Project
Logging and Visualization with TensorBoard
Introduction
Welcome to the third and final module of the project! You have done great so far!
The goal of this final task is to design and implement an educational framework that enhances your understanding of machine learning (ML) concepts in the context of GIS-based crop trait analysis. The framework employs a novel, visualization-driven approach using TensorBoard to provide real-time insights into key ML processes such as data preparation, model training, feature selection, and prediction evaluation. By integrating interactive visualization tools, this task aims to bridge the gap between theoretical knowledge and practical application, making complex ML processes intuitive and engaging.
In basic terms, think of this final project as building a hands-on, visual toolkit that shows you exactly how machine learning works when you’re studying crop traits on a map. Instead of just reading about boring math, you’ll see live, colorful graphs (using TensorBoard) that update as you:
- Clean and prep your data
- Train your model
- Pick which traits (features) matter most
- Check how well your model’s predictions match reality
By turning abstract ideas into interactive visuals, you’ll move from “just theory” to actually watching machine learning happen in real time—and have fun doing it!
Introduction to TensorBoard
What Is TensorBoard?
We will be utilziing Tensorboard, so lets first learn what it is! TensorBoard is a free, browser-based tool developed by Google that helps you visualize and track machine learning (ML) experiments in real time. Though originally built for deep learning, you can use it for any workflow where you want to:
- Compare multiple models’ performance (e.g., see which one predicts best).
- Log images, graphs, and metrics (like error rates) as your code runs.
- Share visual results with classmates or teachers via a simple link.
Why learn TensorBoard?
- Clarity: Watch your algorithms in action—no more “black box.”
- Interactivity: Zoom, pan, and scroll through training history.
- Collaboration: Share logs so peers can inspect your results firsthand.
- Future-Ready: Data-science jobs often expect you to know visualization and ML tools.
Before You Begin
In this section, you will be revisiting code that you and your team utilized in sections one and two . The idea now is that you will be using a framework called TensorBoard. This framework employs a novel, visualization-driven approach to provide real-time insights into key ML processes such as data preparation, model training, feature selection, and prediction evaluation. By integrating interactive visualization tools, this task aims to bridge the gap between theoretical knowledge and practical application, making the complex ML processes that you have already seen more intuitive and engaging.
Remember the Heatmap image we created and saved from the QGIS/Python code? For this module, you will need to have your Heatmap_Layout.png readily available. Please see this set of instructions once more if you cannot find your Heatmap_Layout.png that you generated in Module 1. Find the Saving Your Heatmap section in Module 1 to get the Heatmap.png.
Preparing Your Google Drive
So now you should have your Heatmap_Layout.png image file, great! Let us move on.
- Downloading the needed notebook file
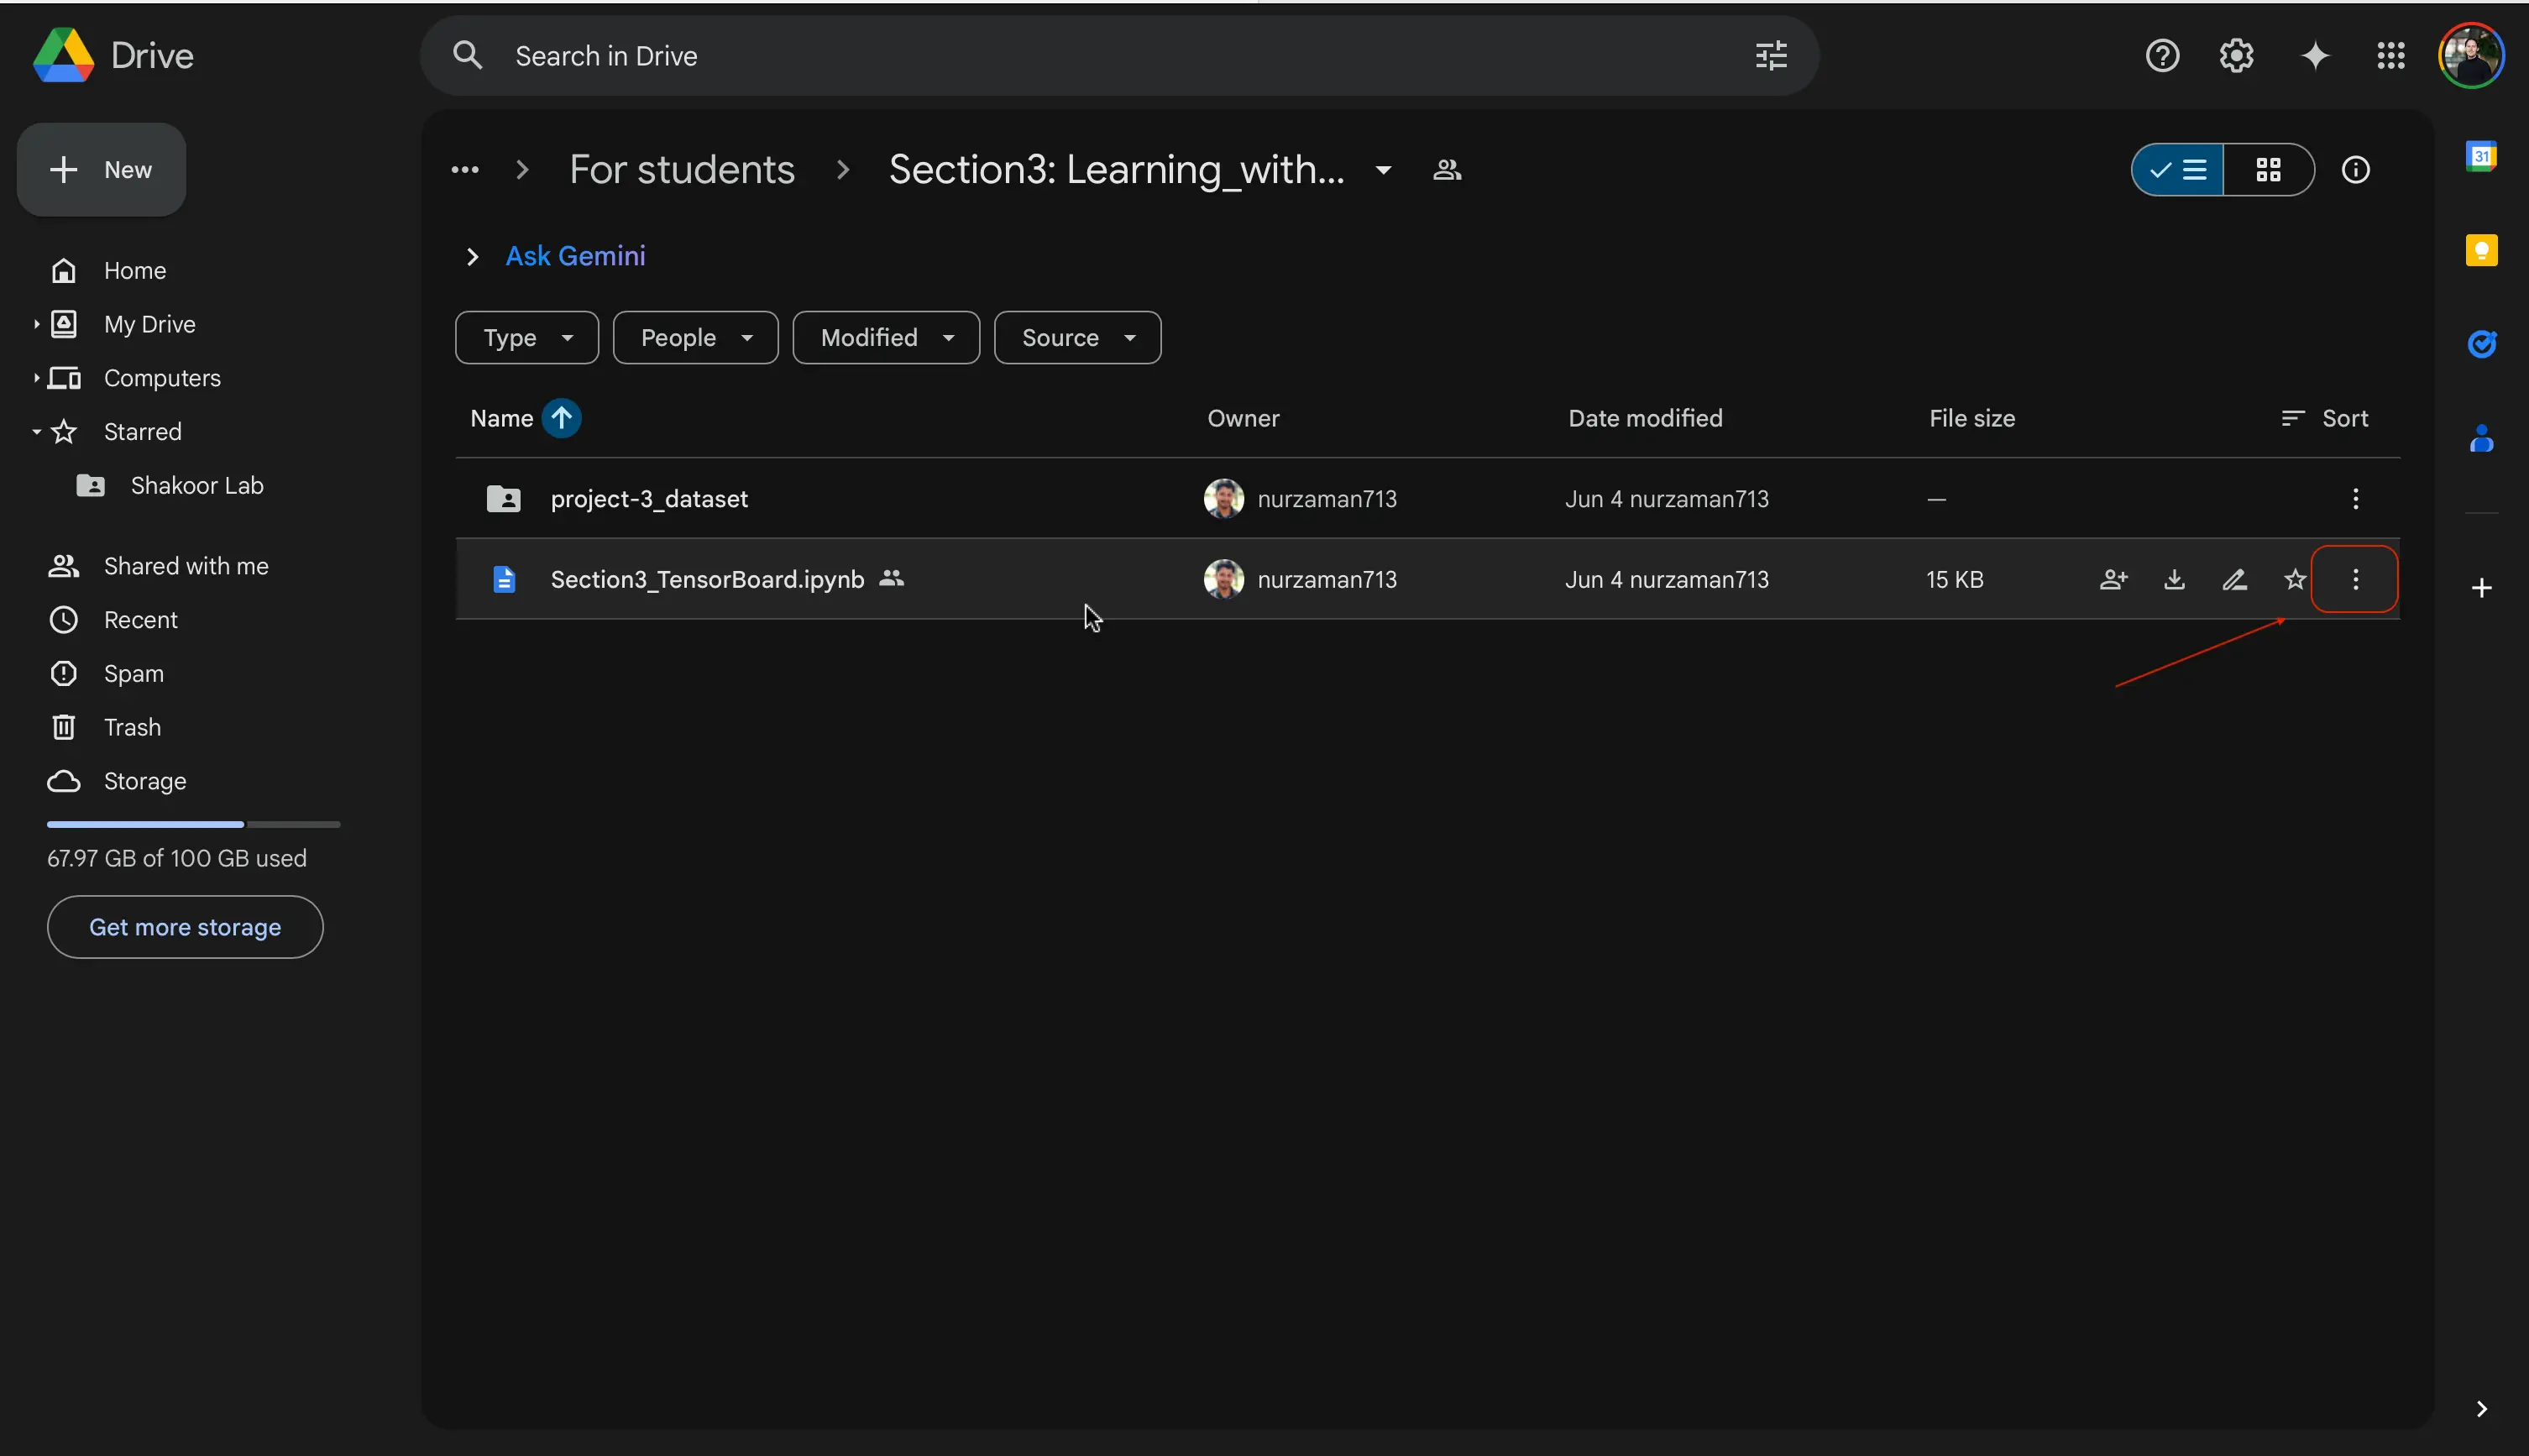
You are going to want to navigate to the Module 3 files here. You will be looking for a folder called Section3: Learning_with_TensorBoard.
Once inside this folder, you will see now see a notebook file called: Section3_TensorBoard.ipynb. Click the three dot icon on the far right to download the notebook file to your local machine.
You should know!
There is another folder you may see called project-3_dataset. This folder is for you to download if you have lost access to your other files, but still want to continue on with Module 3.
- Uploading the notebook
If you do not have Google Colab open already, open Google Colab and ensure you’re signed in with your Google account.
At the top of your google Colab environment in your toolbar, you are going to want to find the
Fileand thenUpload notebookbutton in the dropdown menu.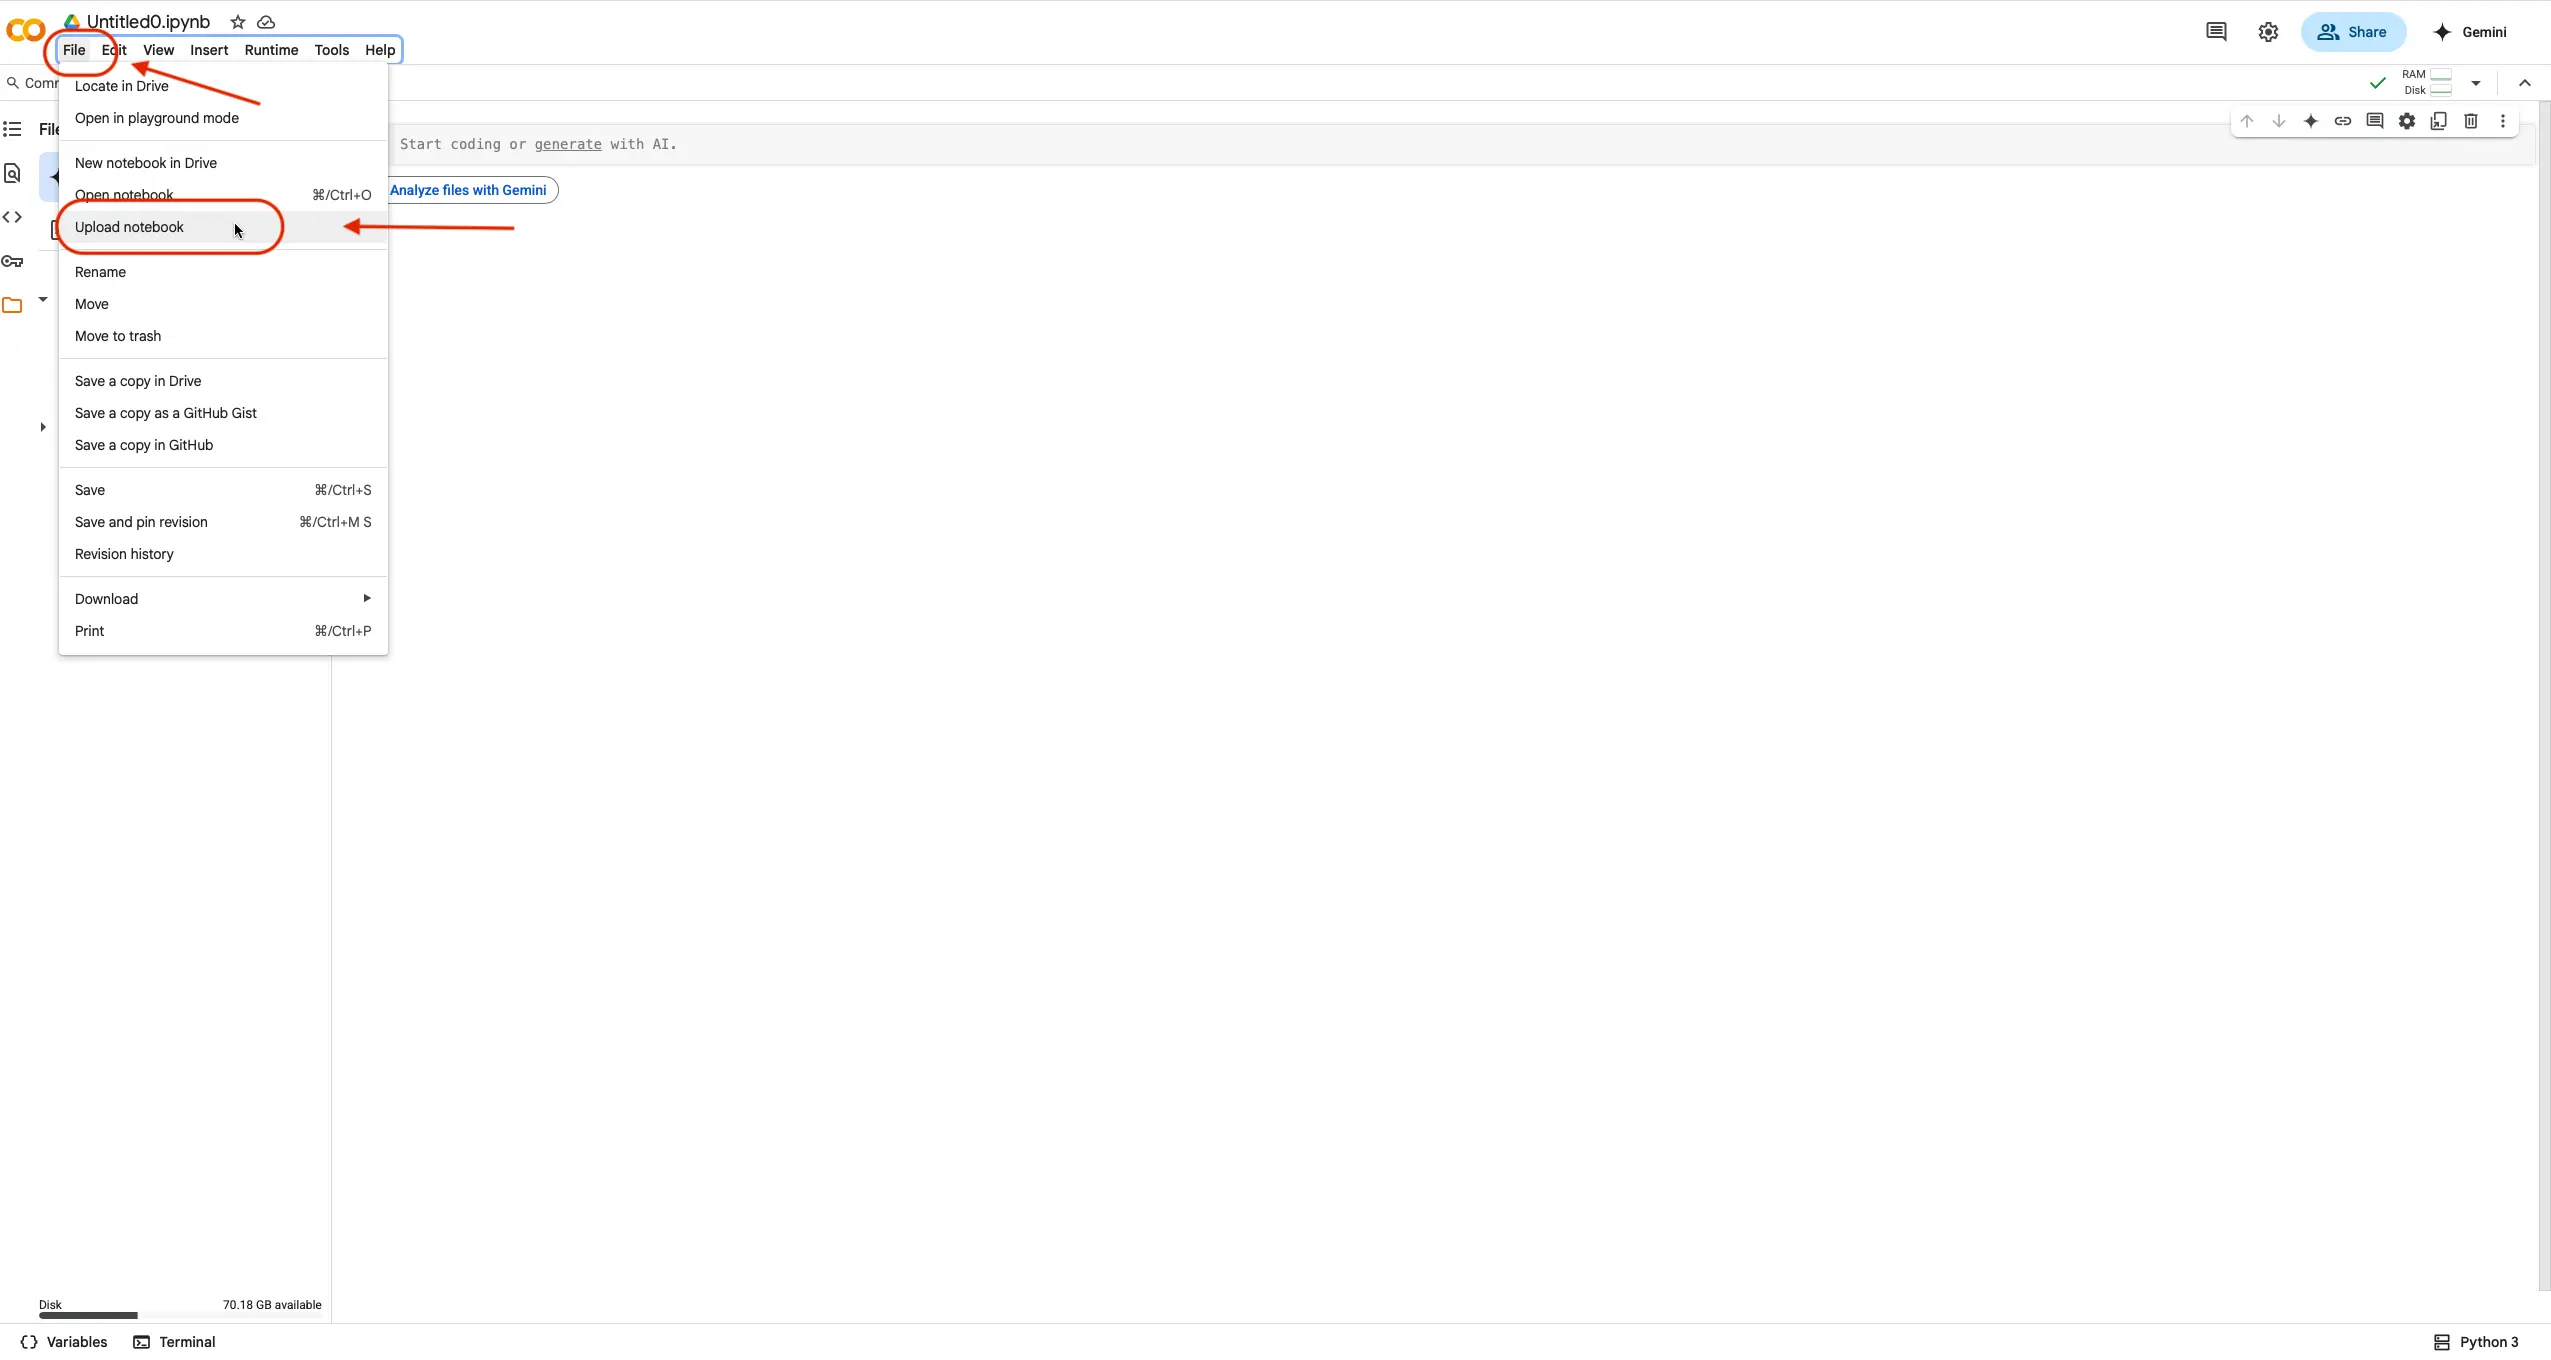
When the option appears, select the
Browsebutton to find the notebook file on your local computer.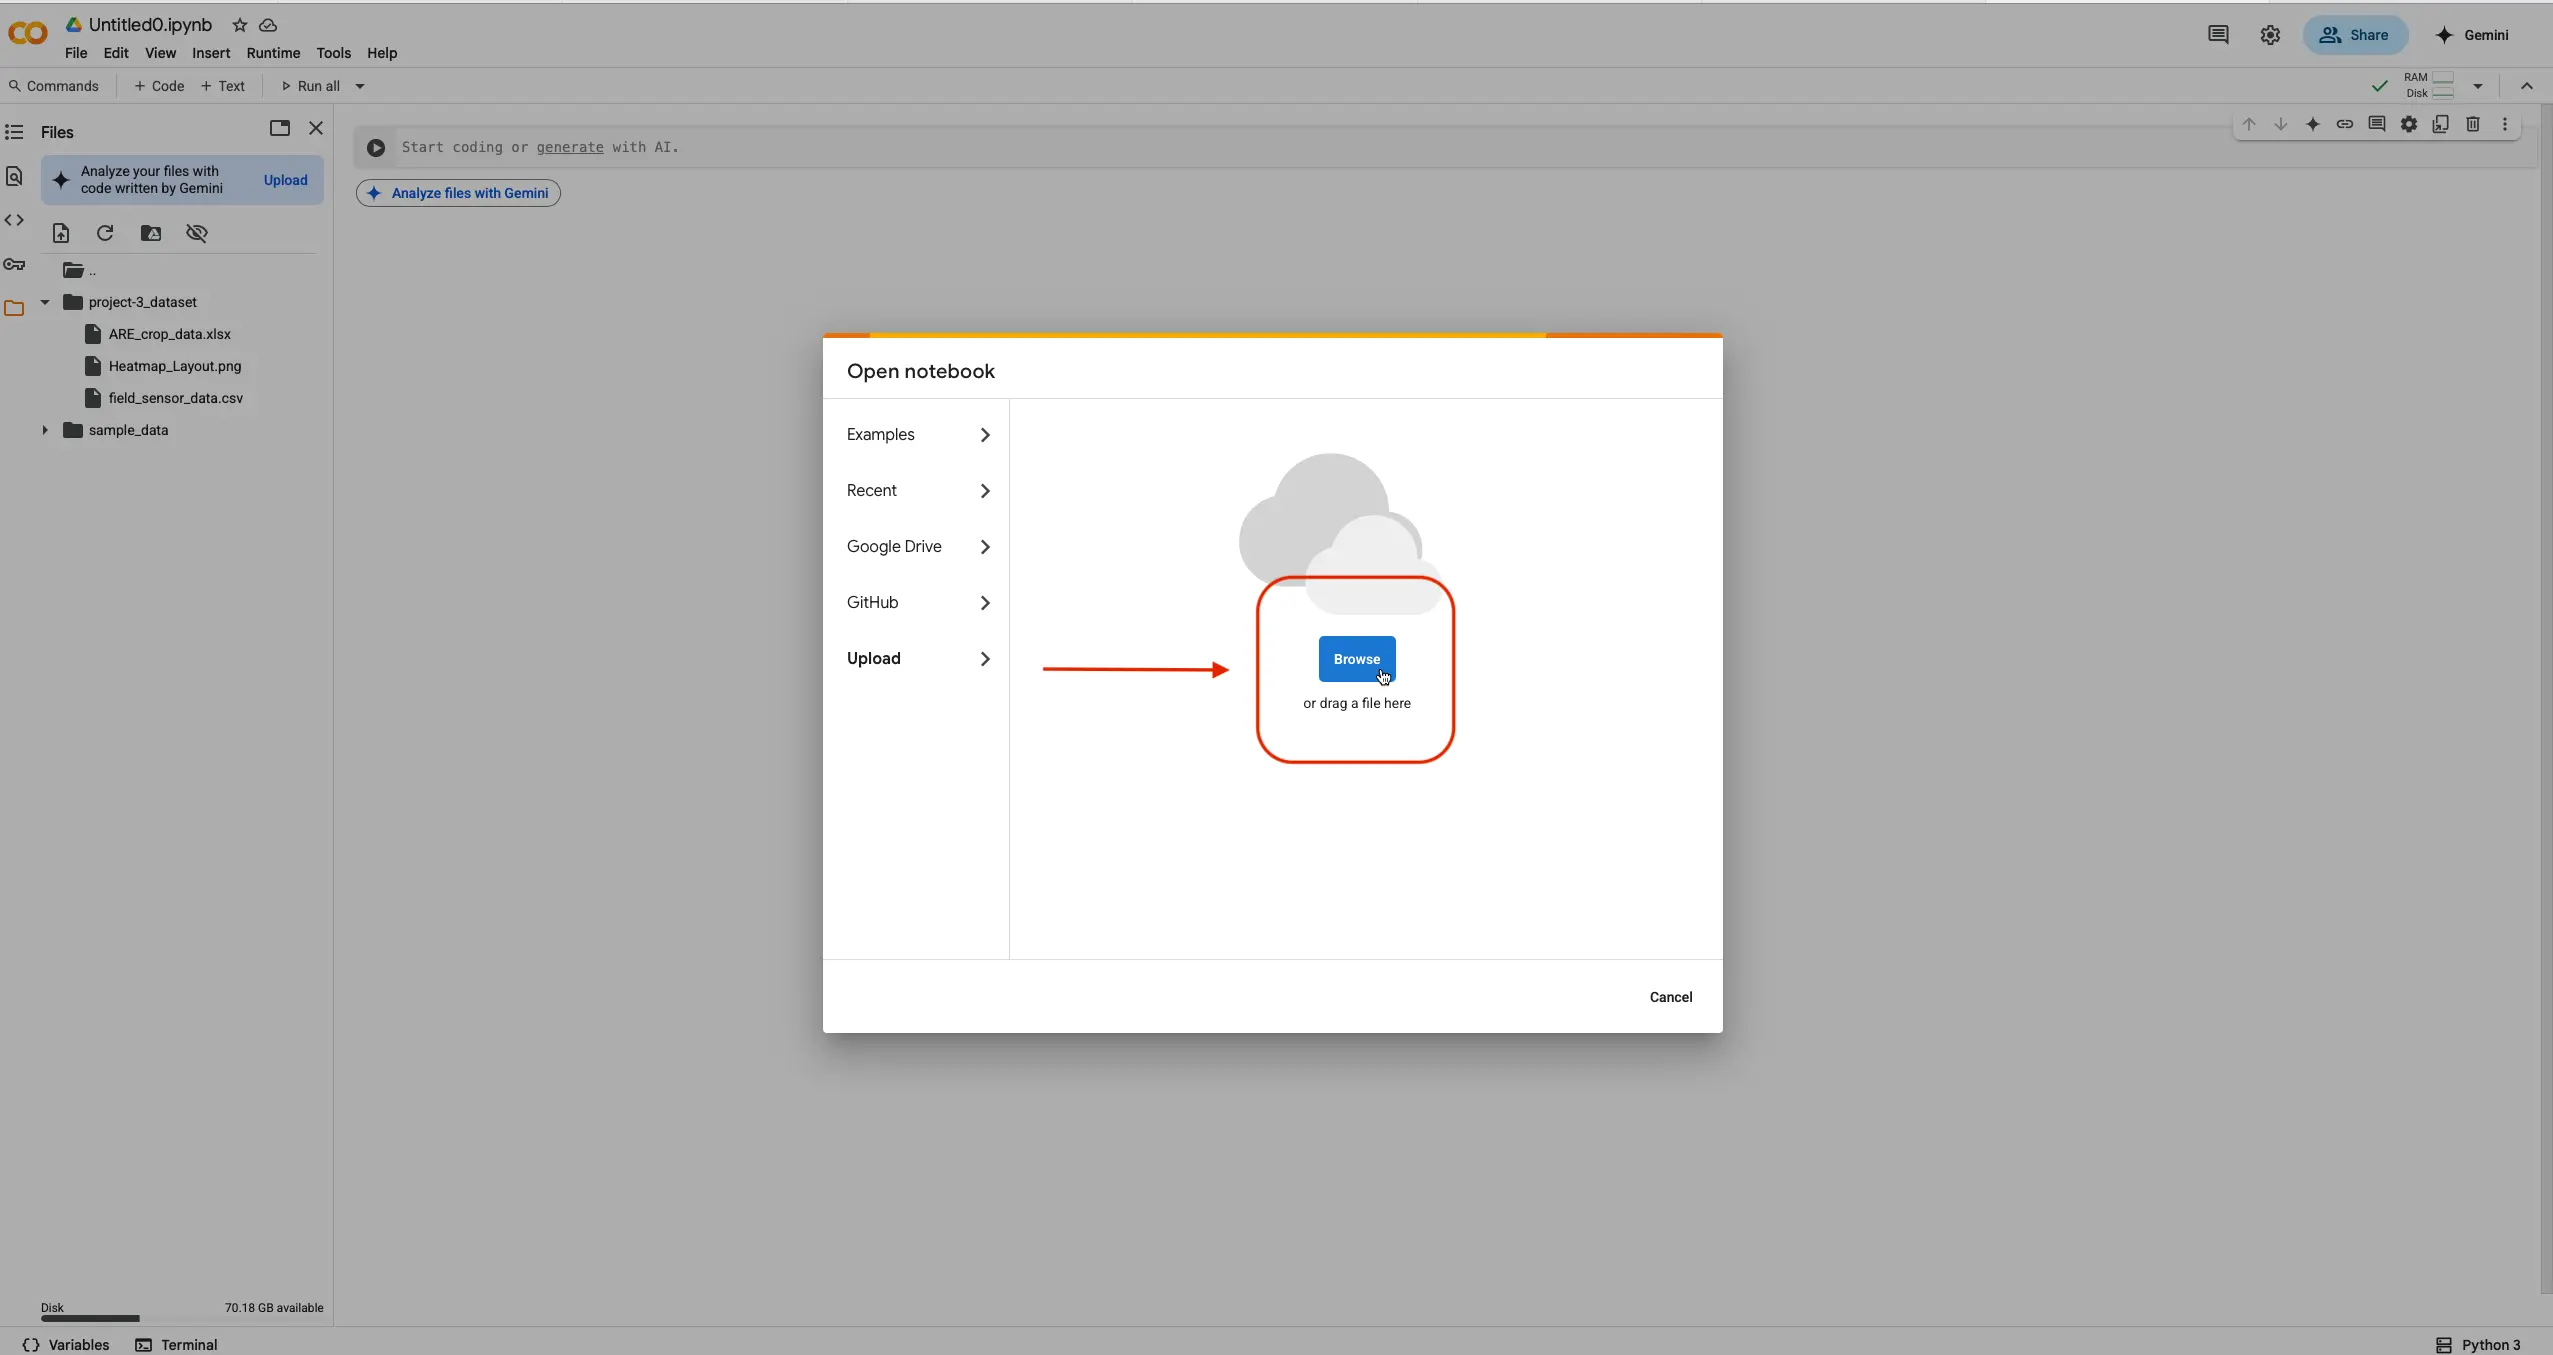
Select the file and hit the
Uploadbutton.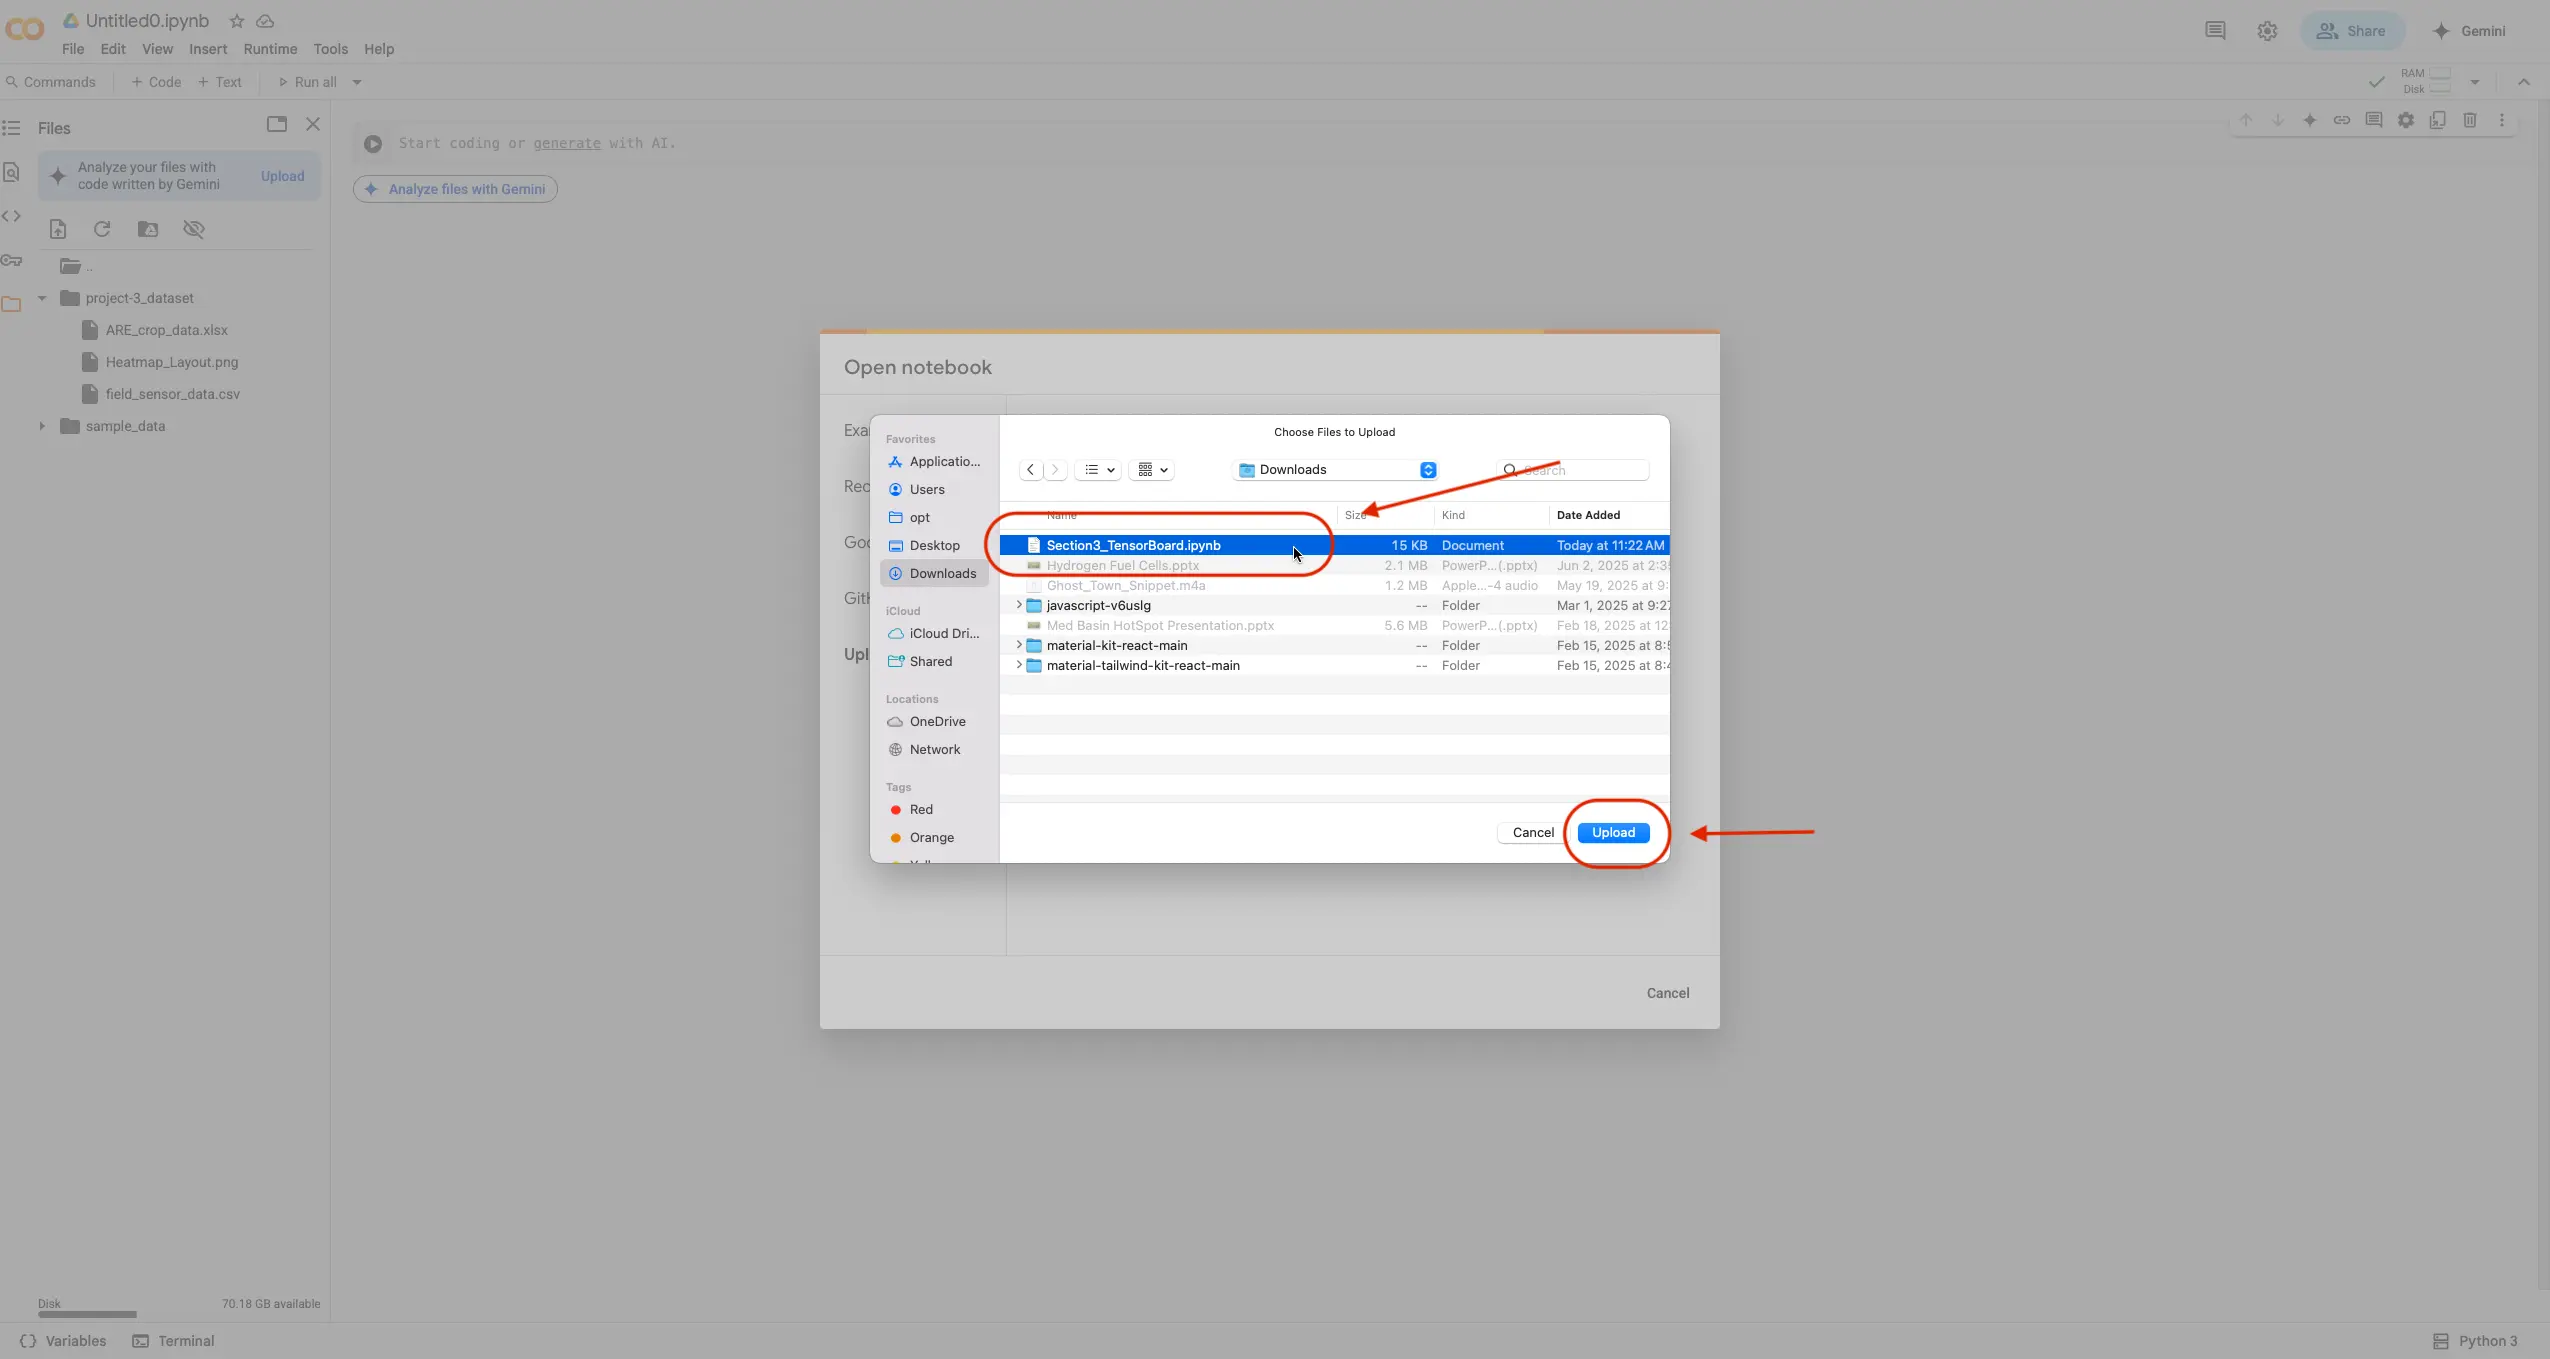
The notebook should now be open in your Google Colab environment!
- Create a “project-3_dataset” Folder
On the left side of the menu click the
Filesicon.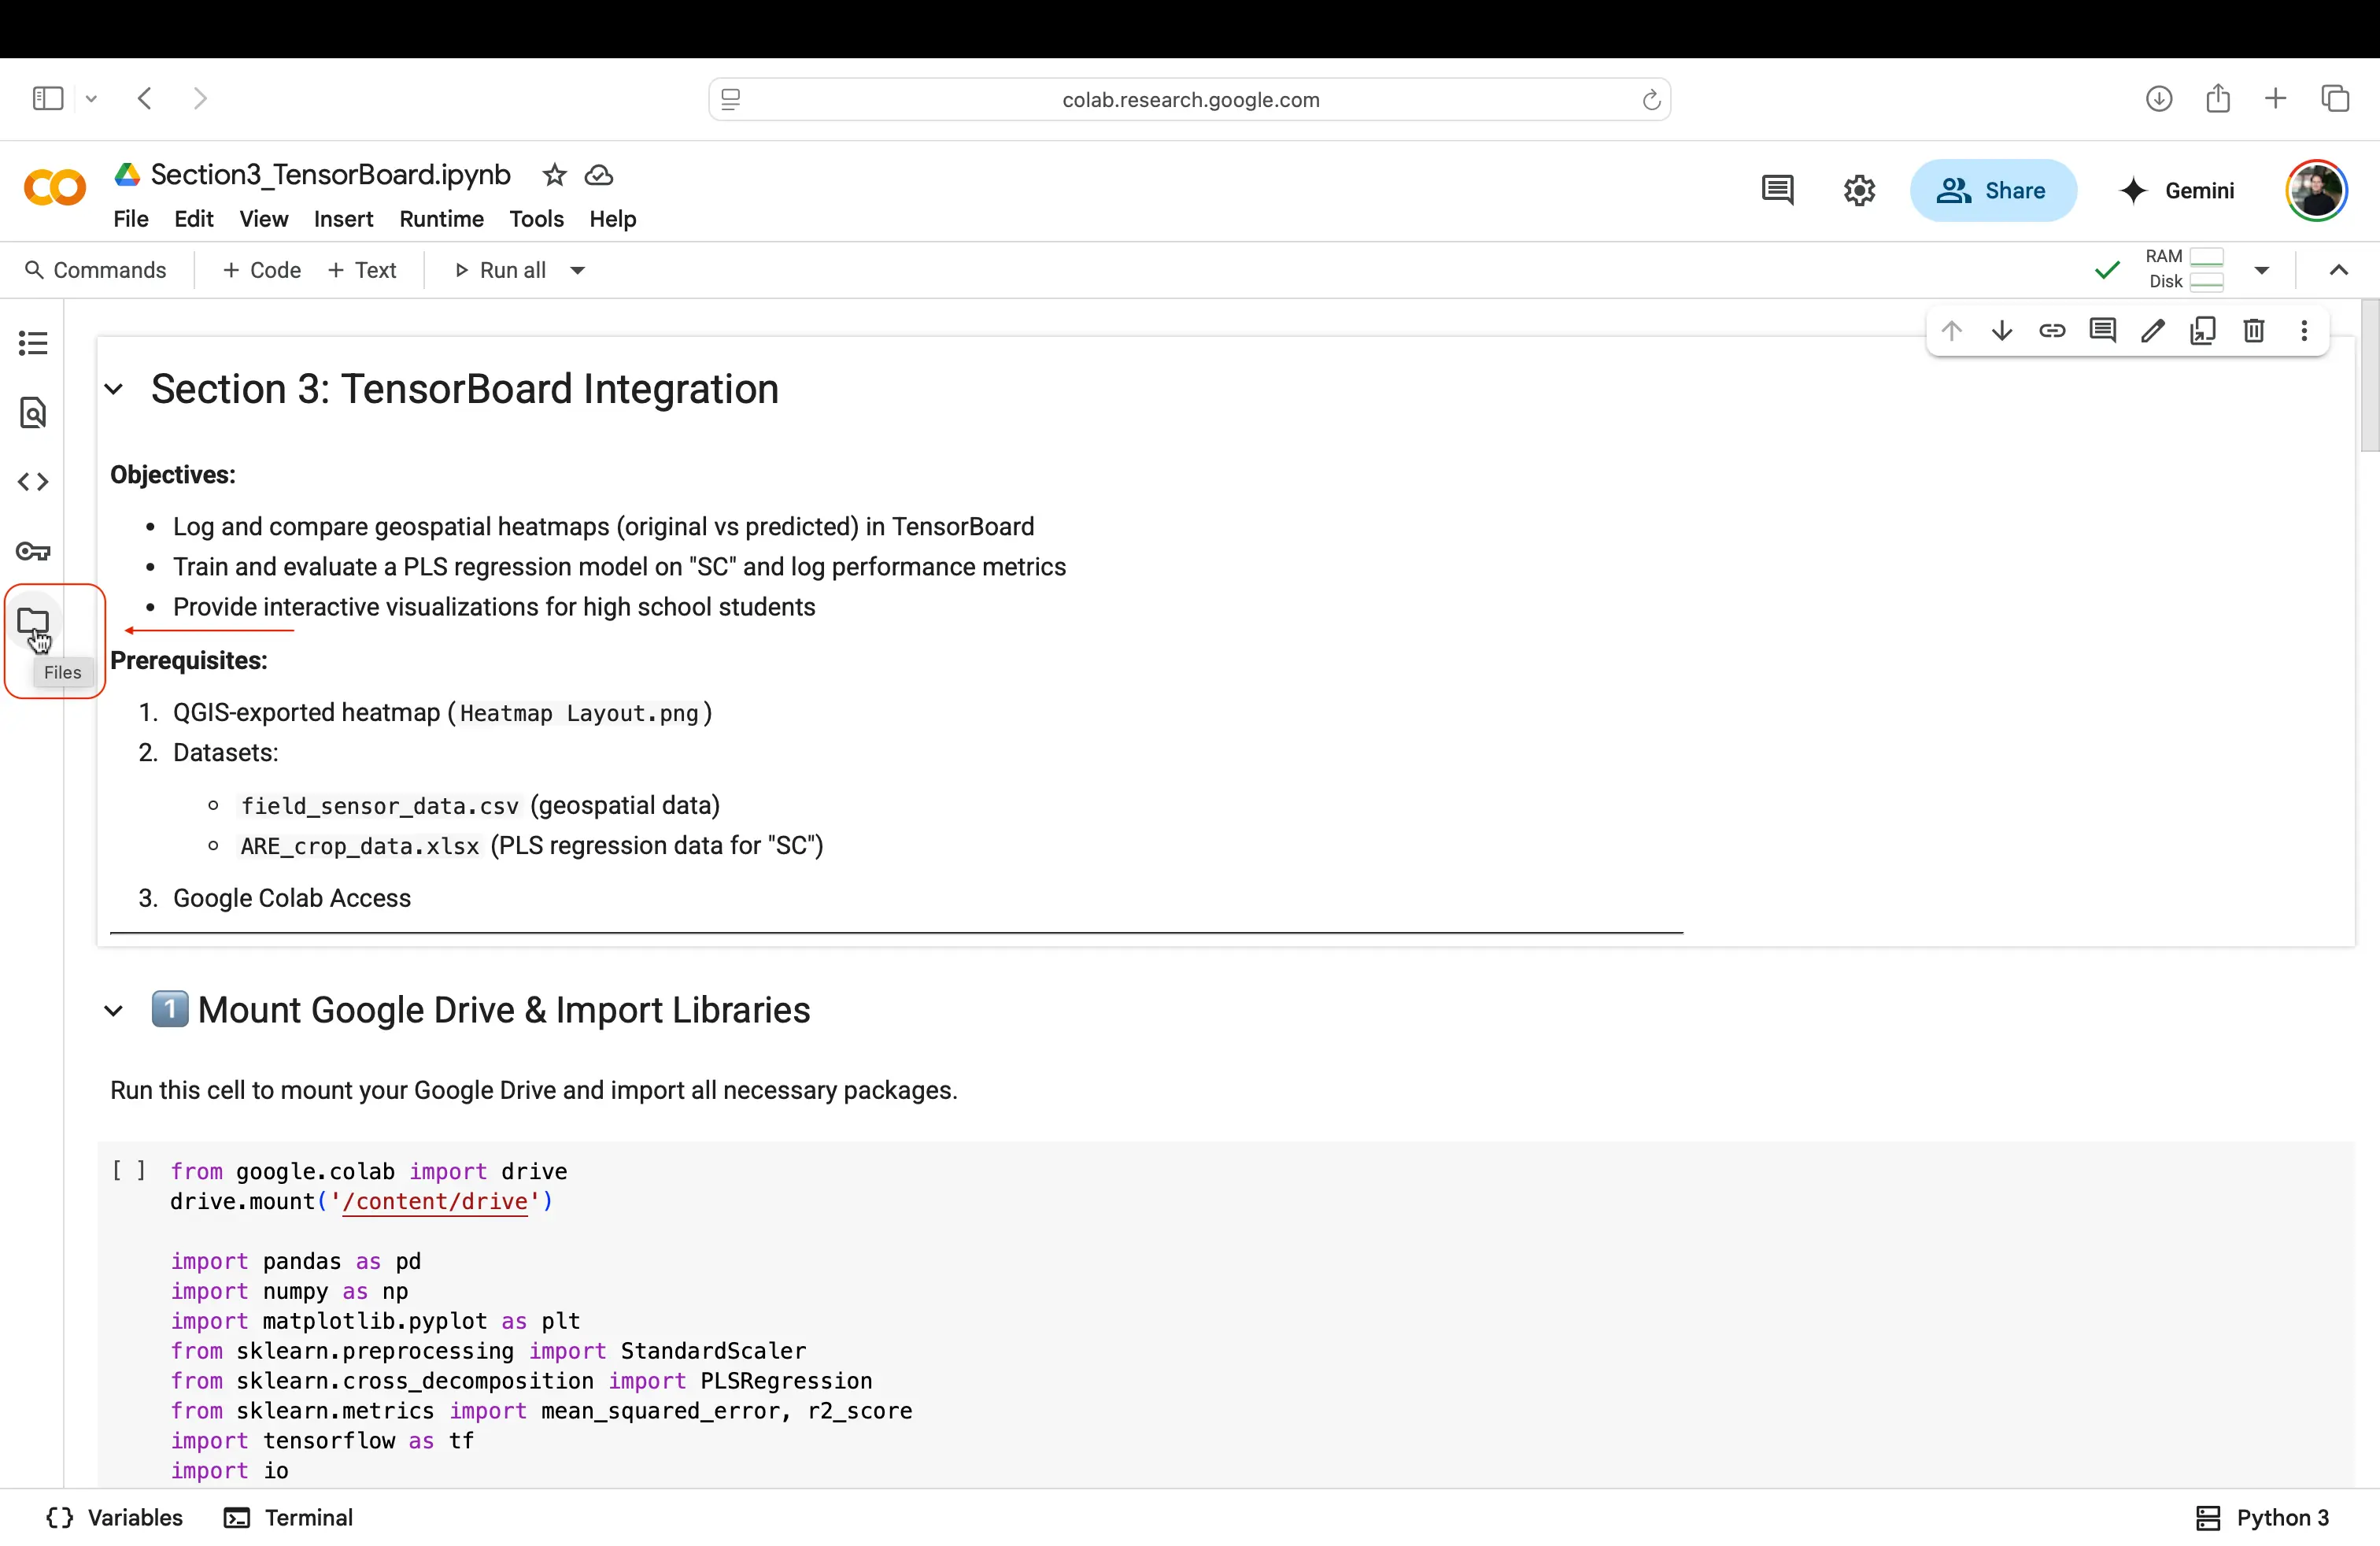
In the Files menu now open, you want to right click using your mouse, and click
New Folder.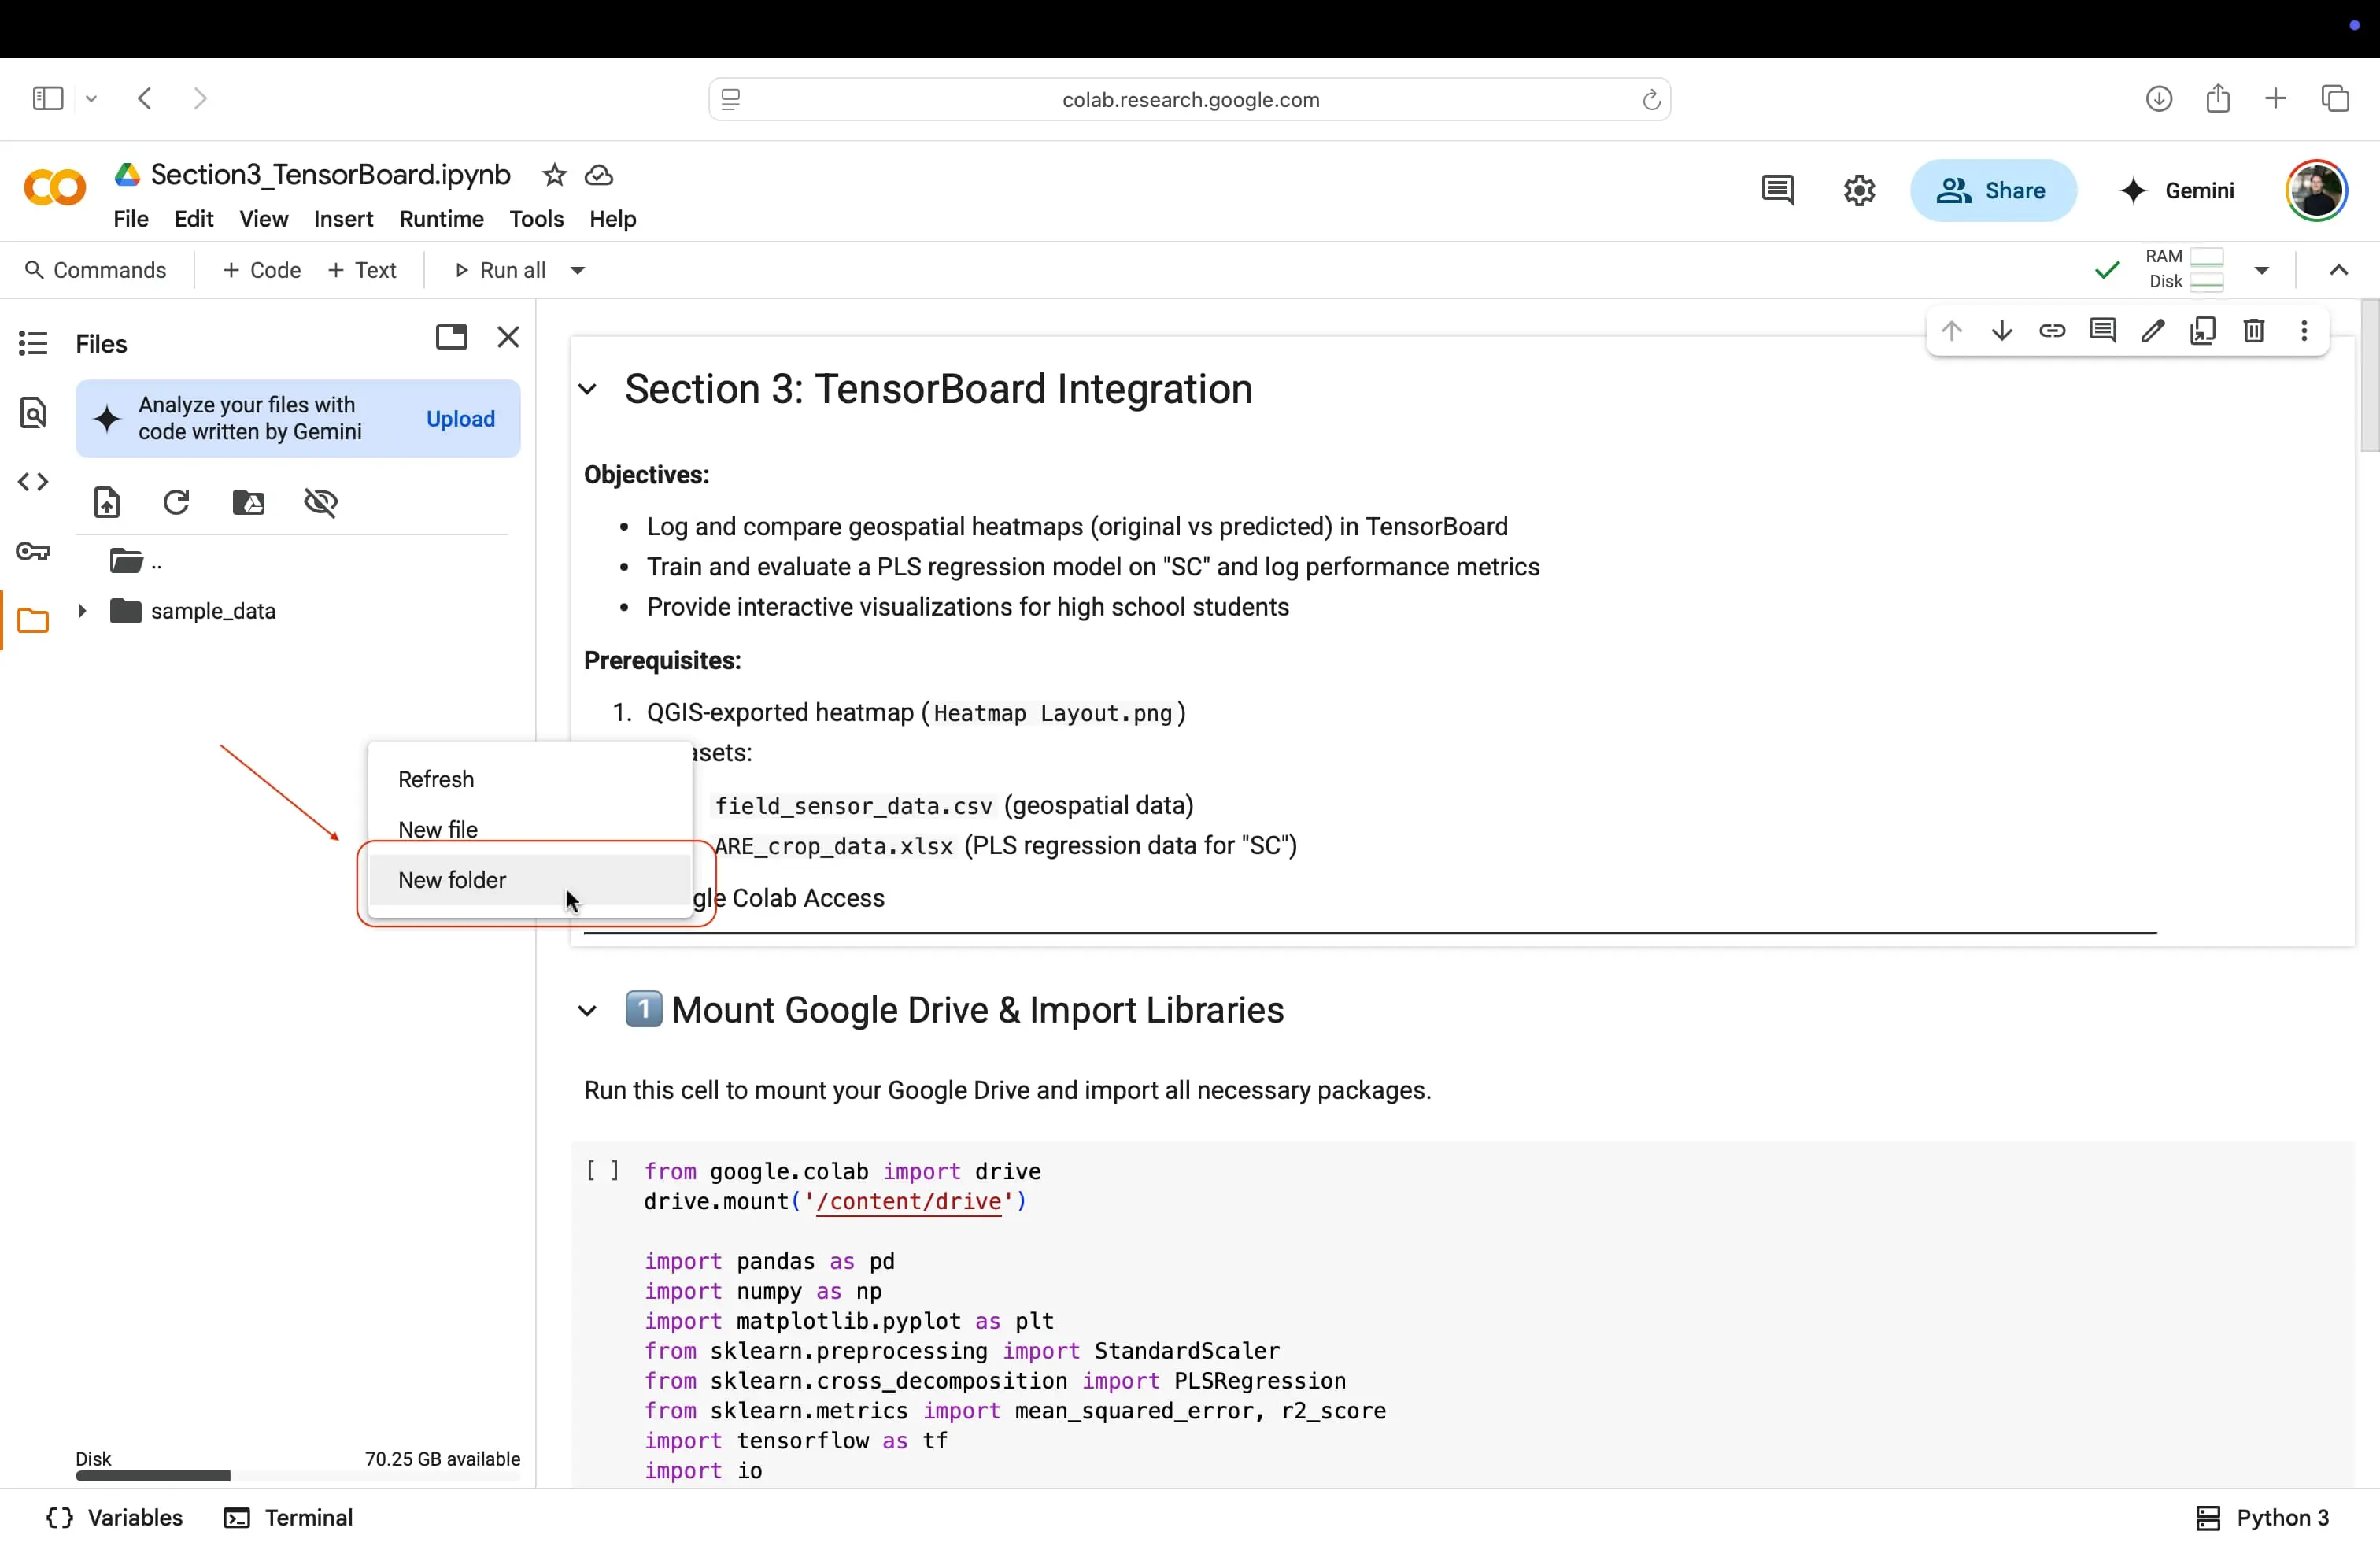
Name it “project-3_dataset”, and click
Create.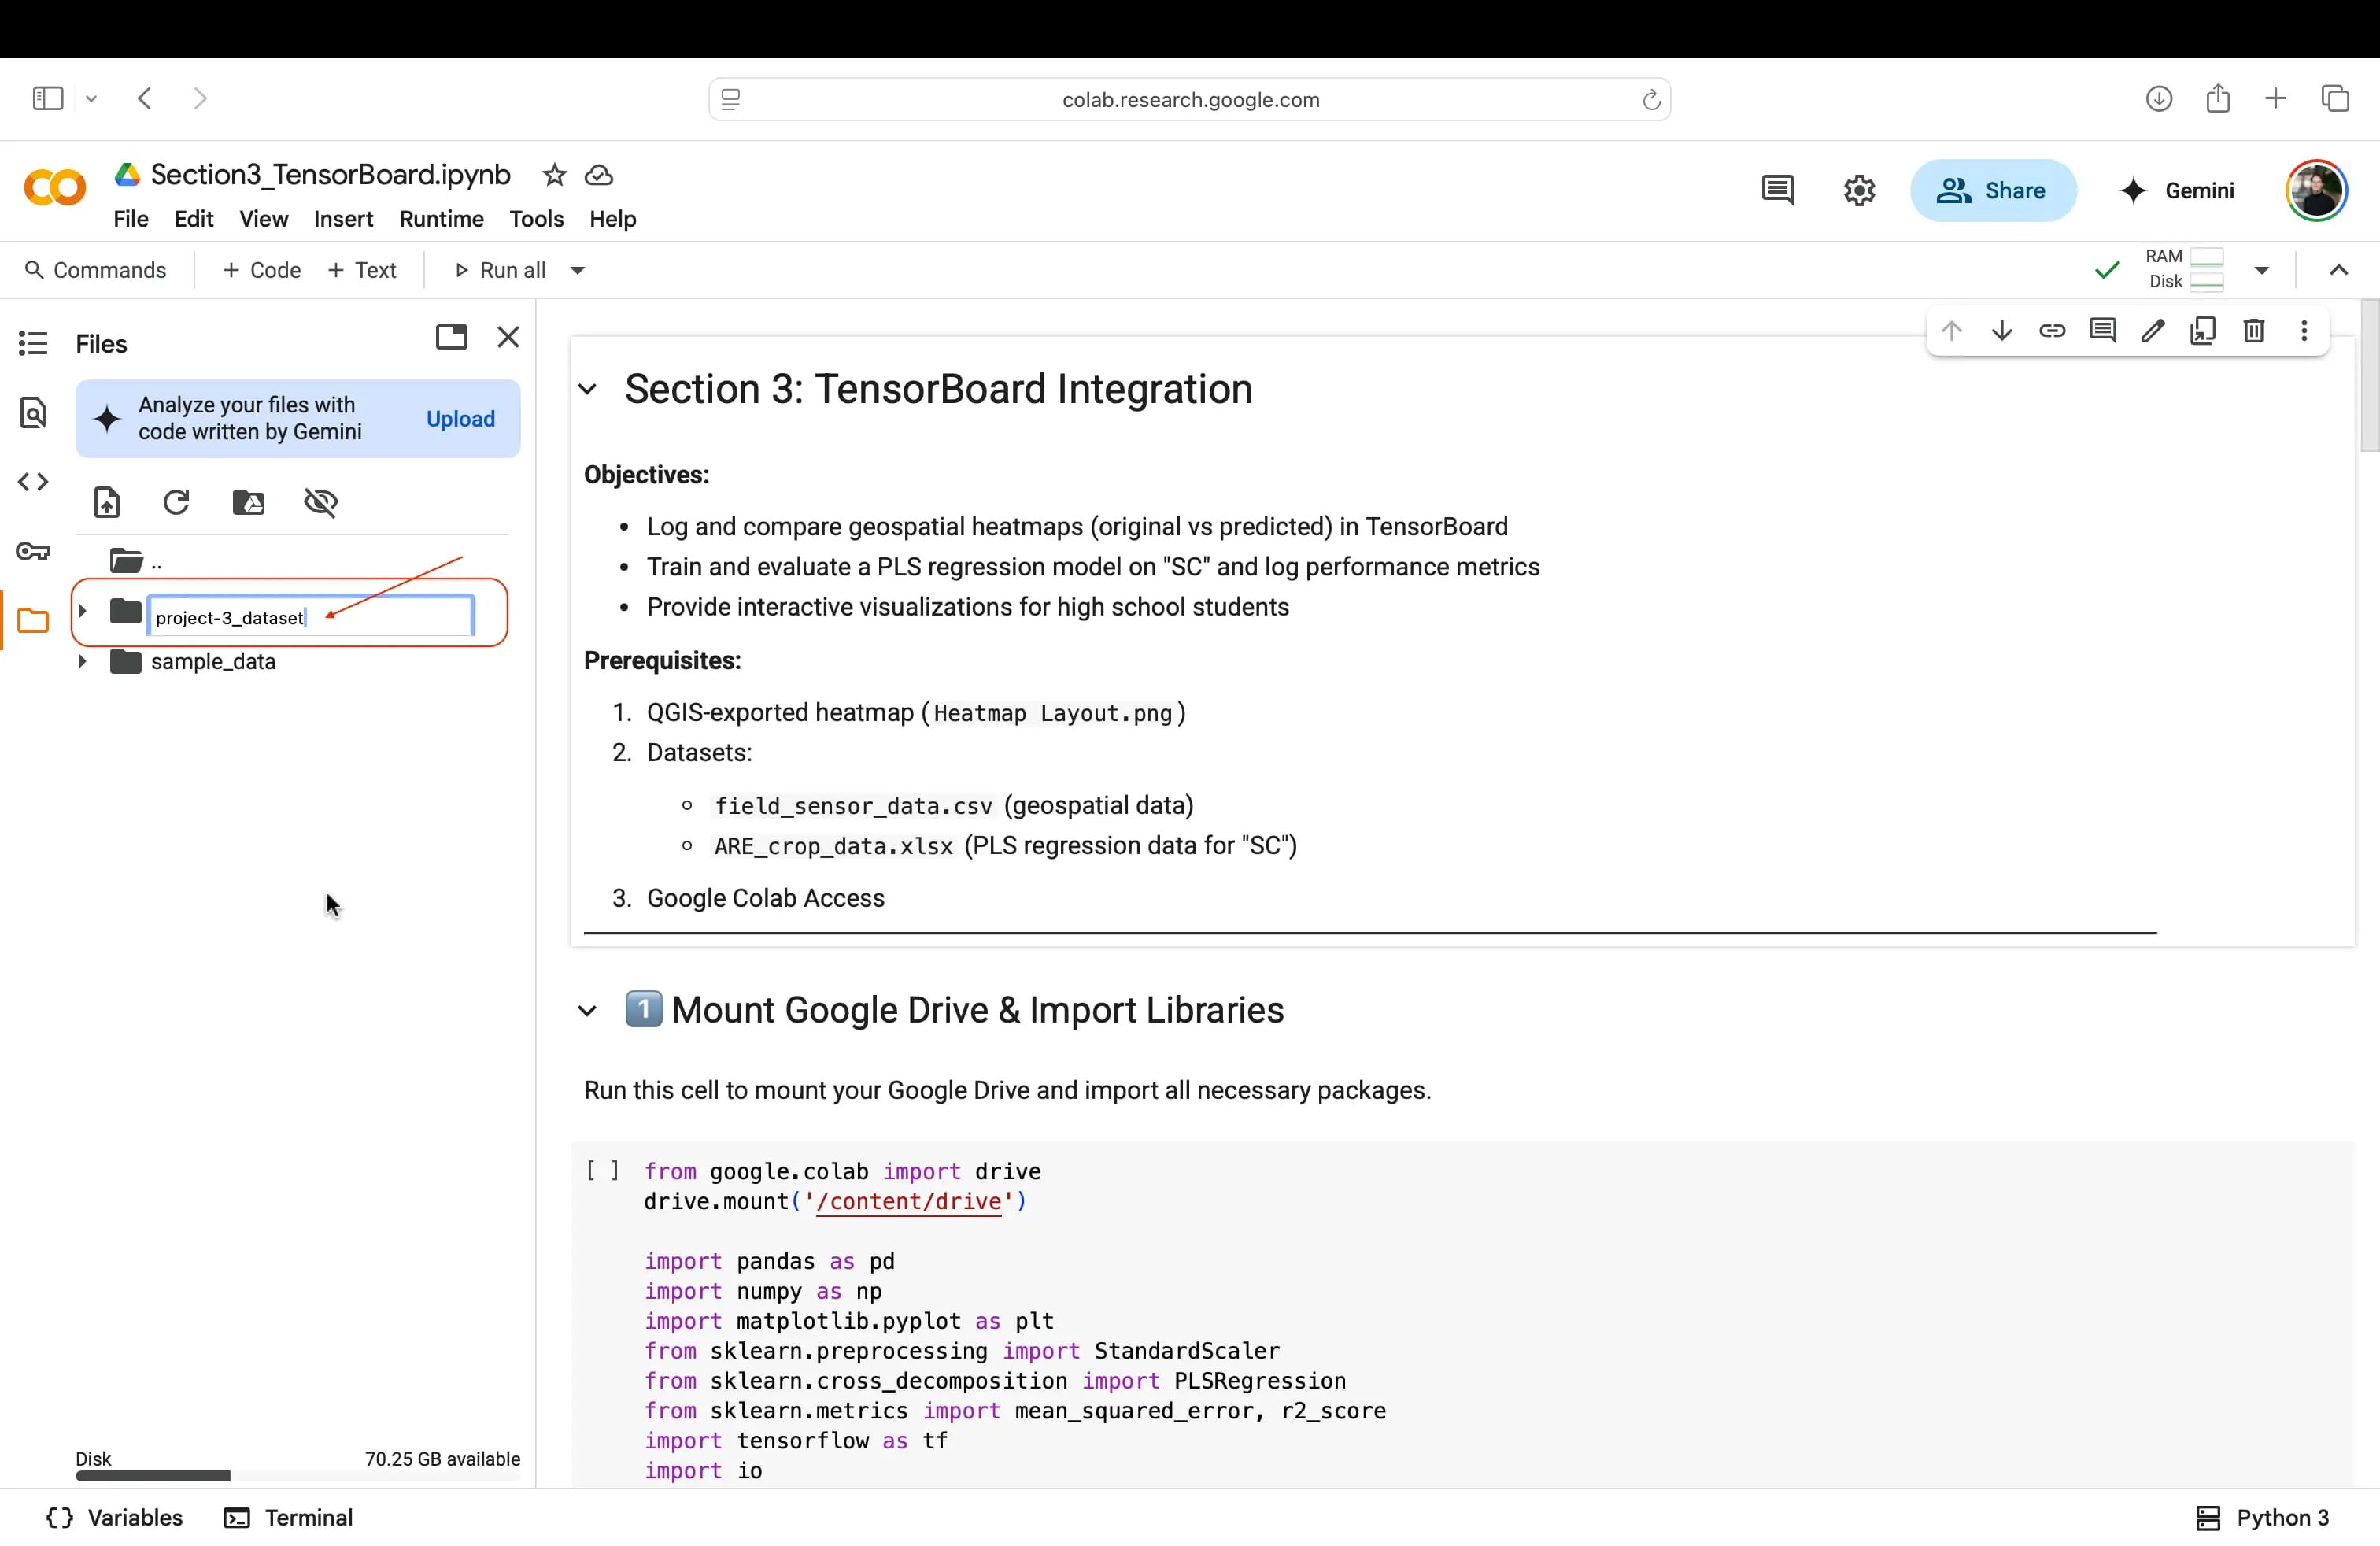
- Upload Files
You will want to right click on the newly created project-3_dataset folder, and then click
Upload.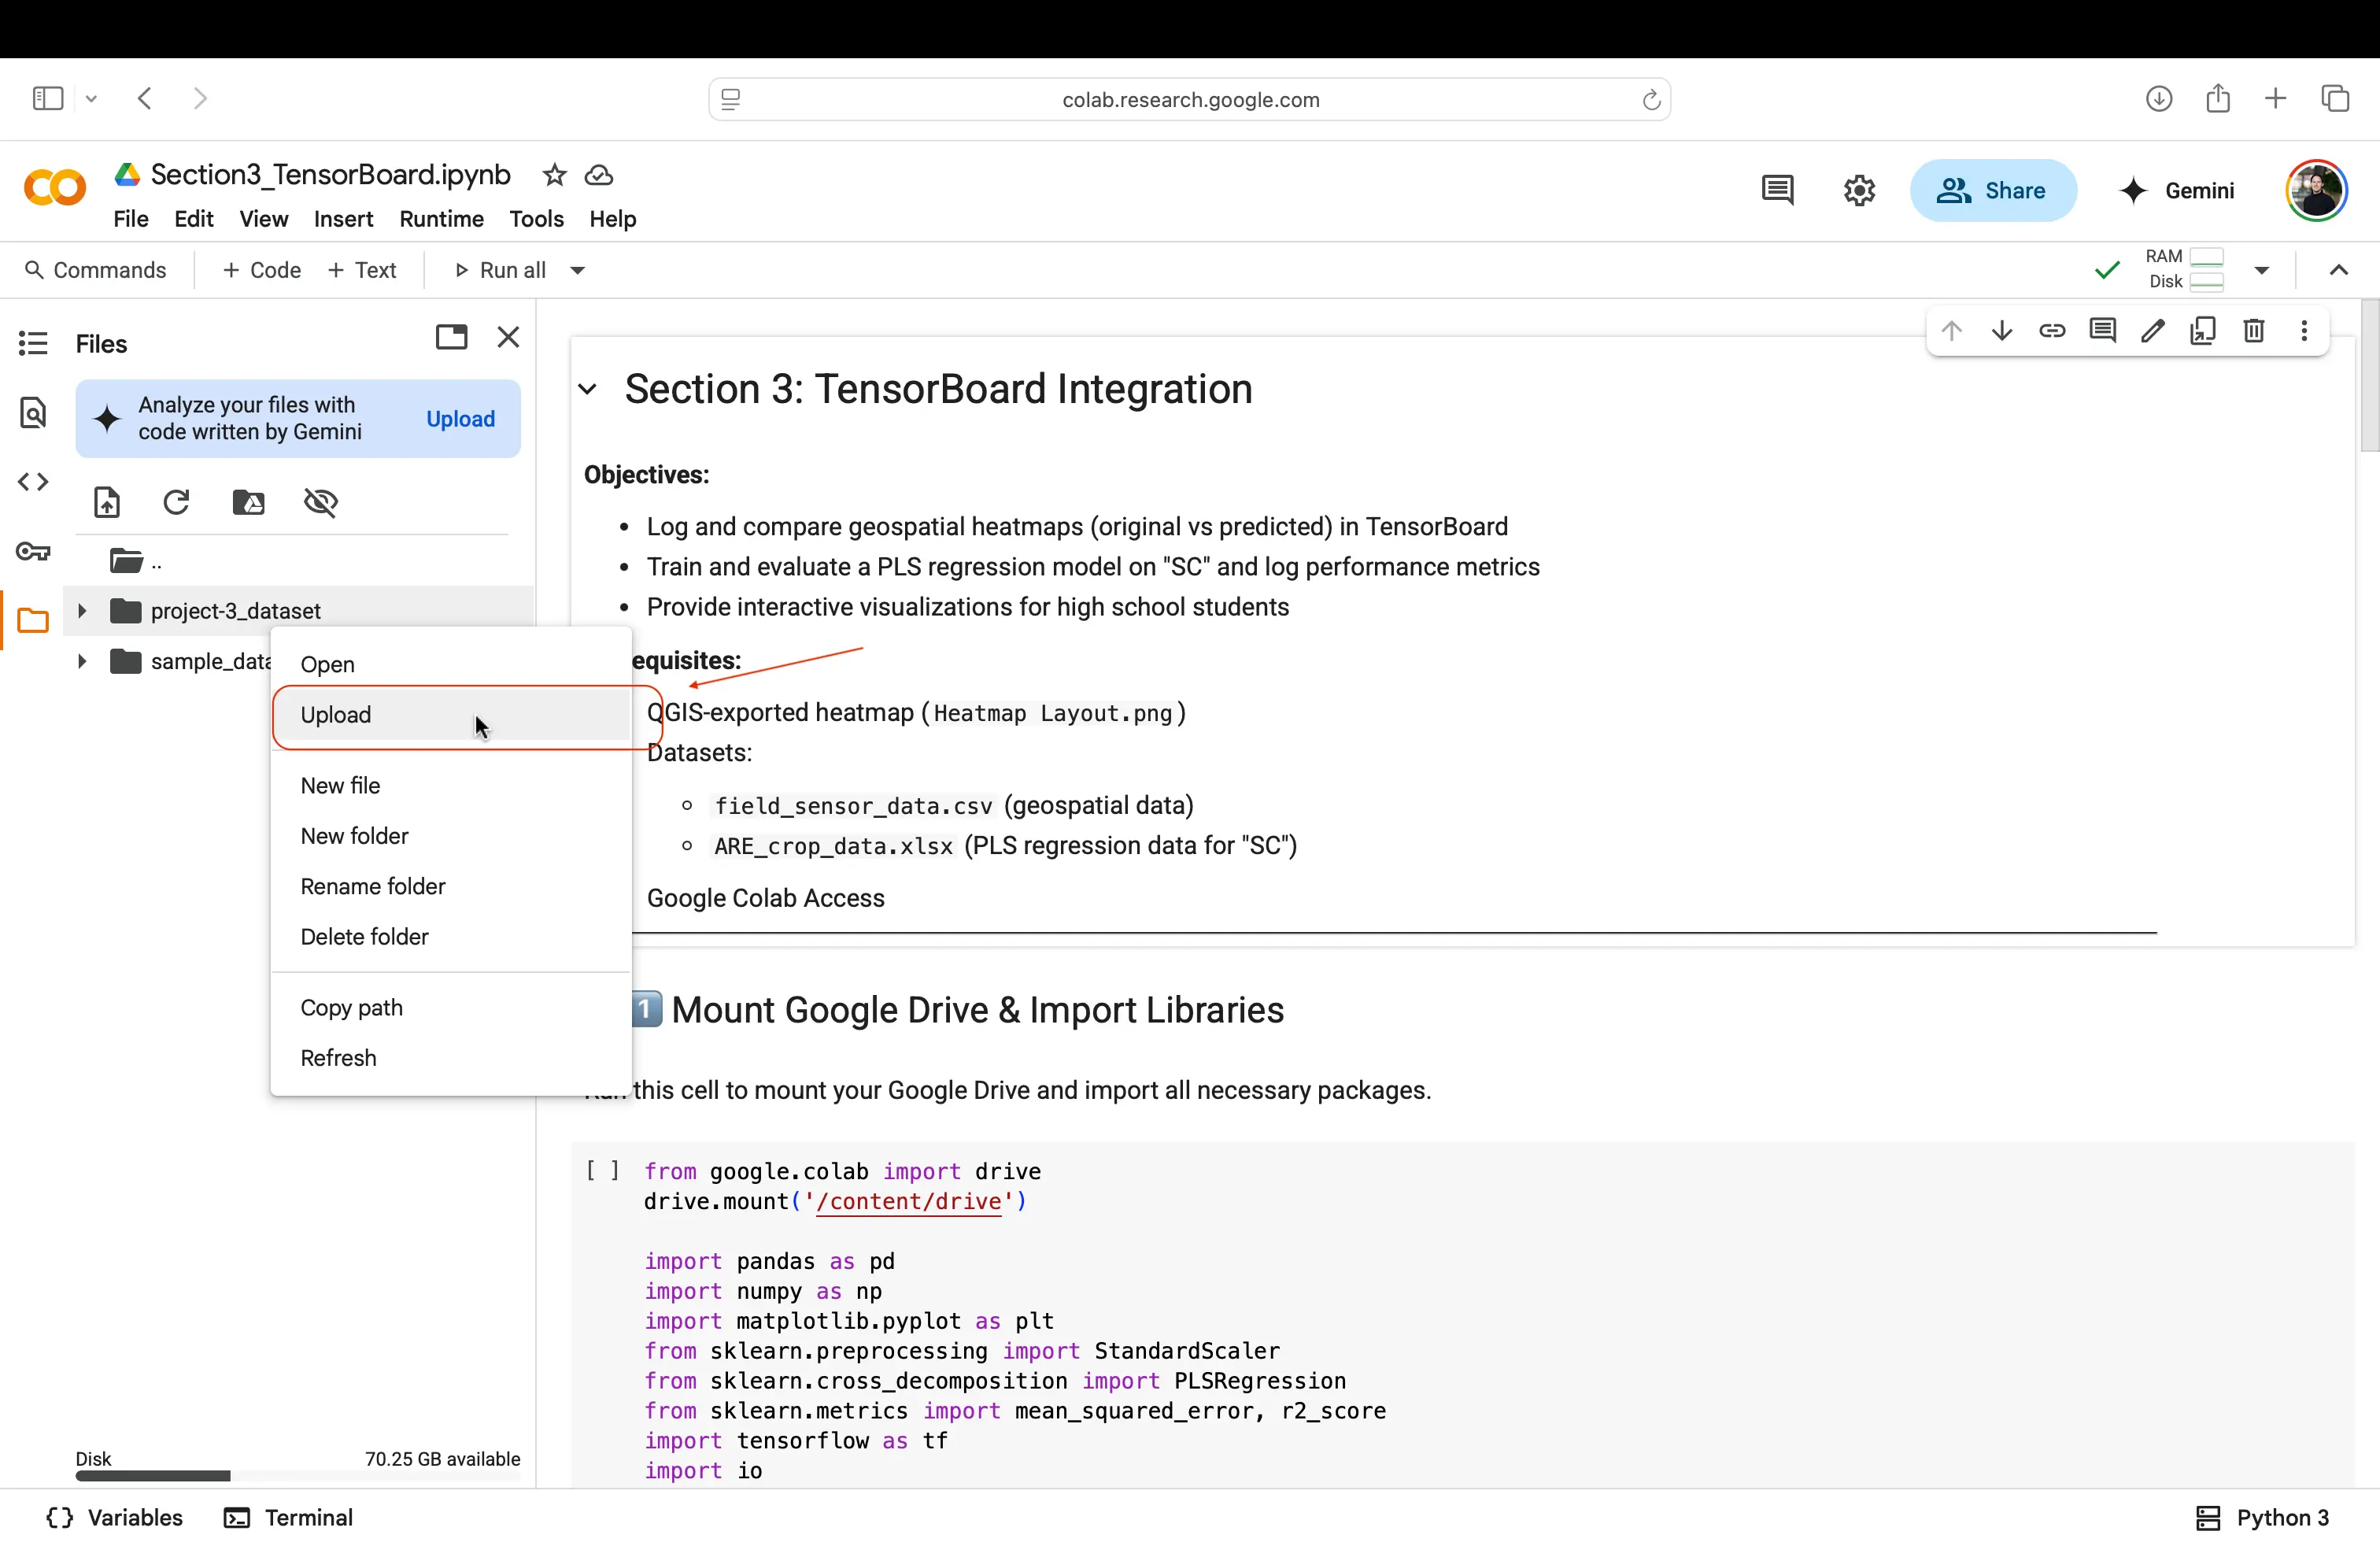
Upload all three files:
- Heatmap_Layout.png (the QGIS‐exported PNG)
- field_sensor_data.csv (field sensor data)
- ARE_crop_data.xlsx (crop data)
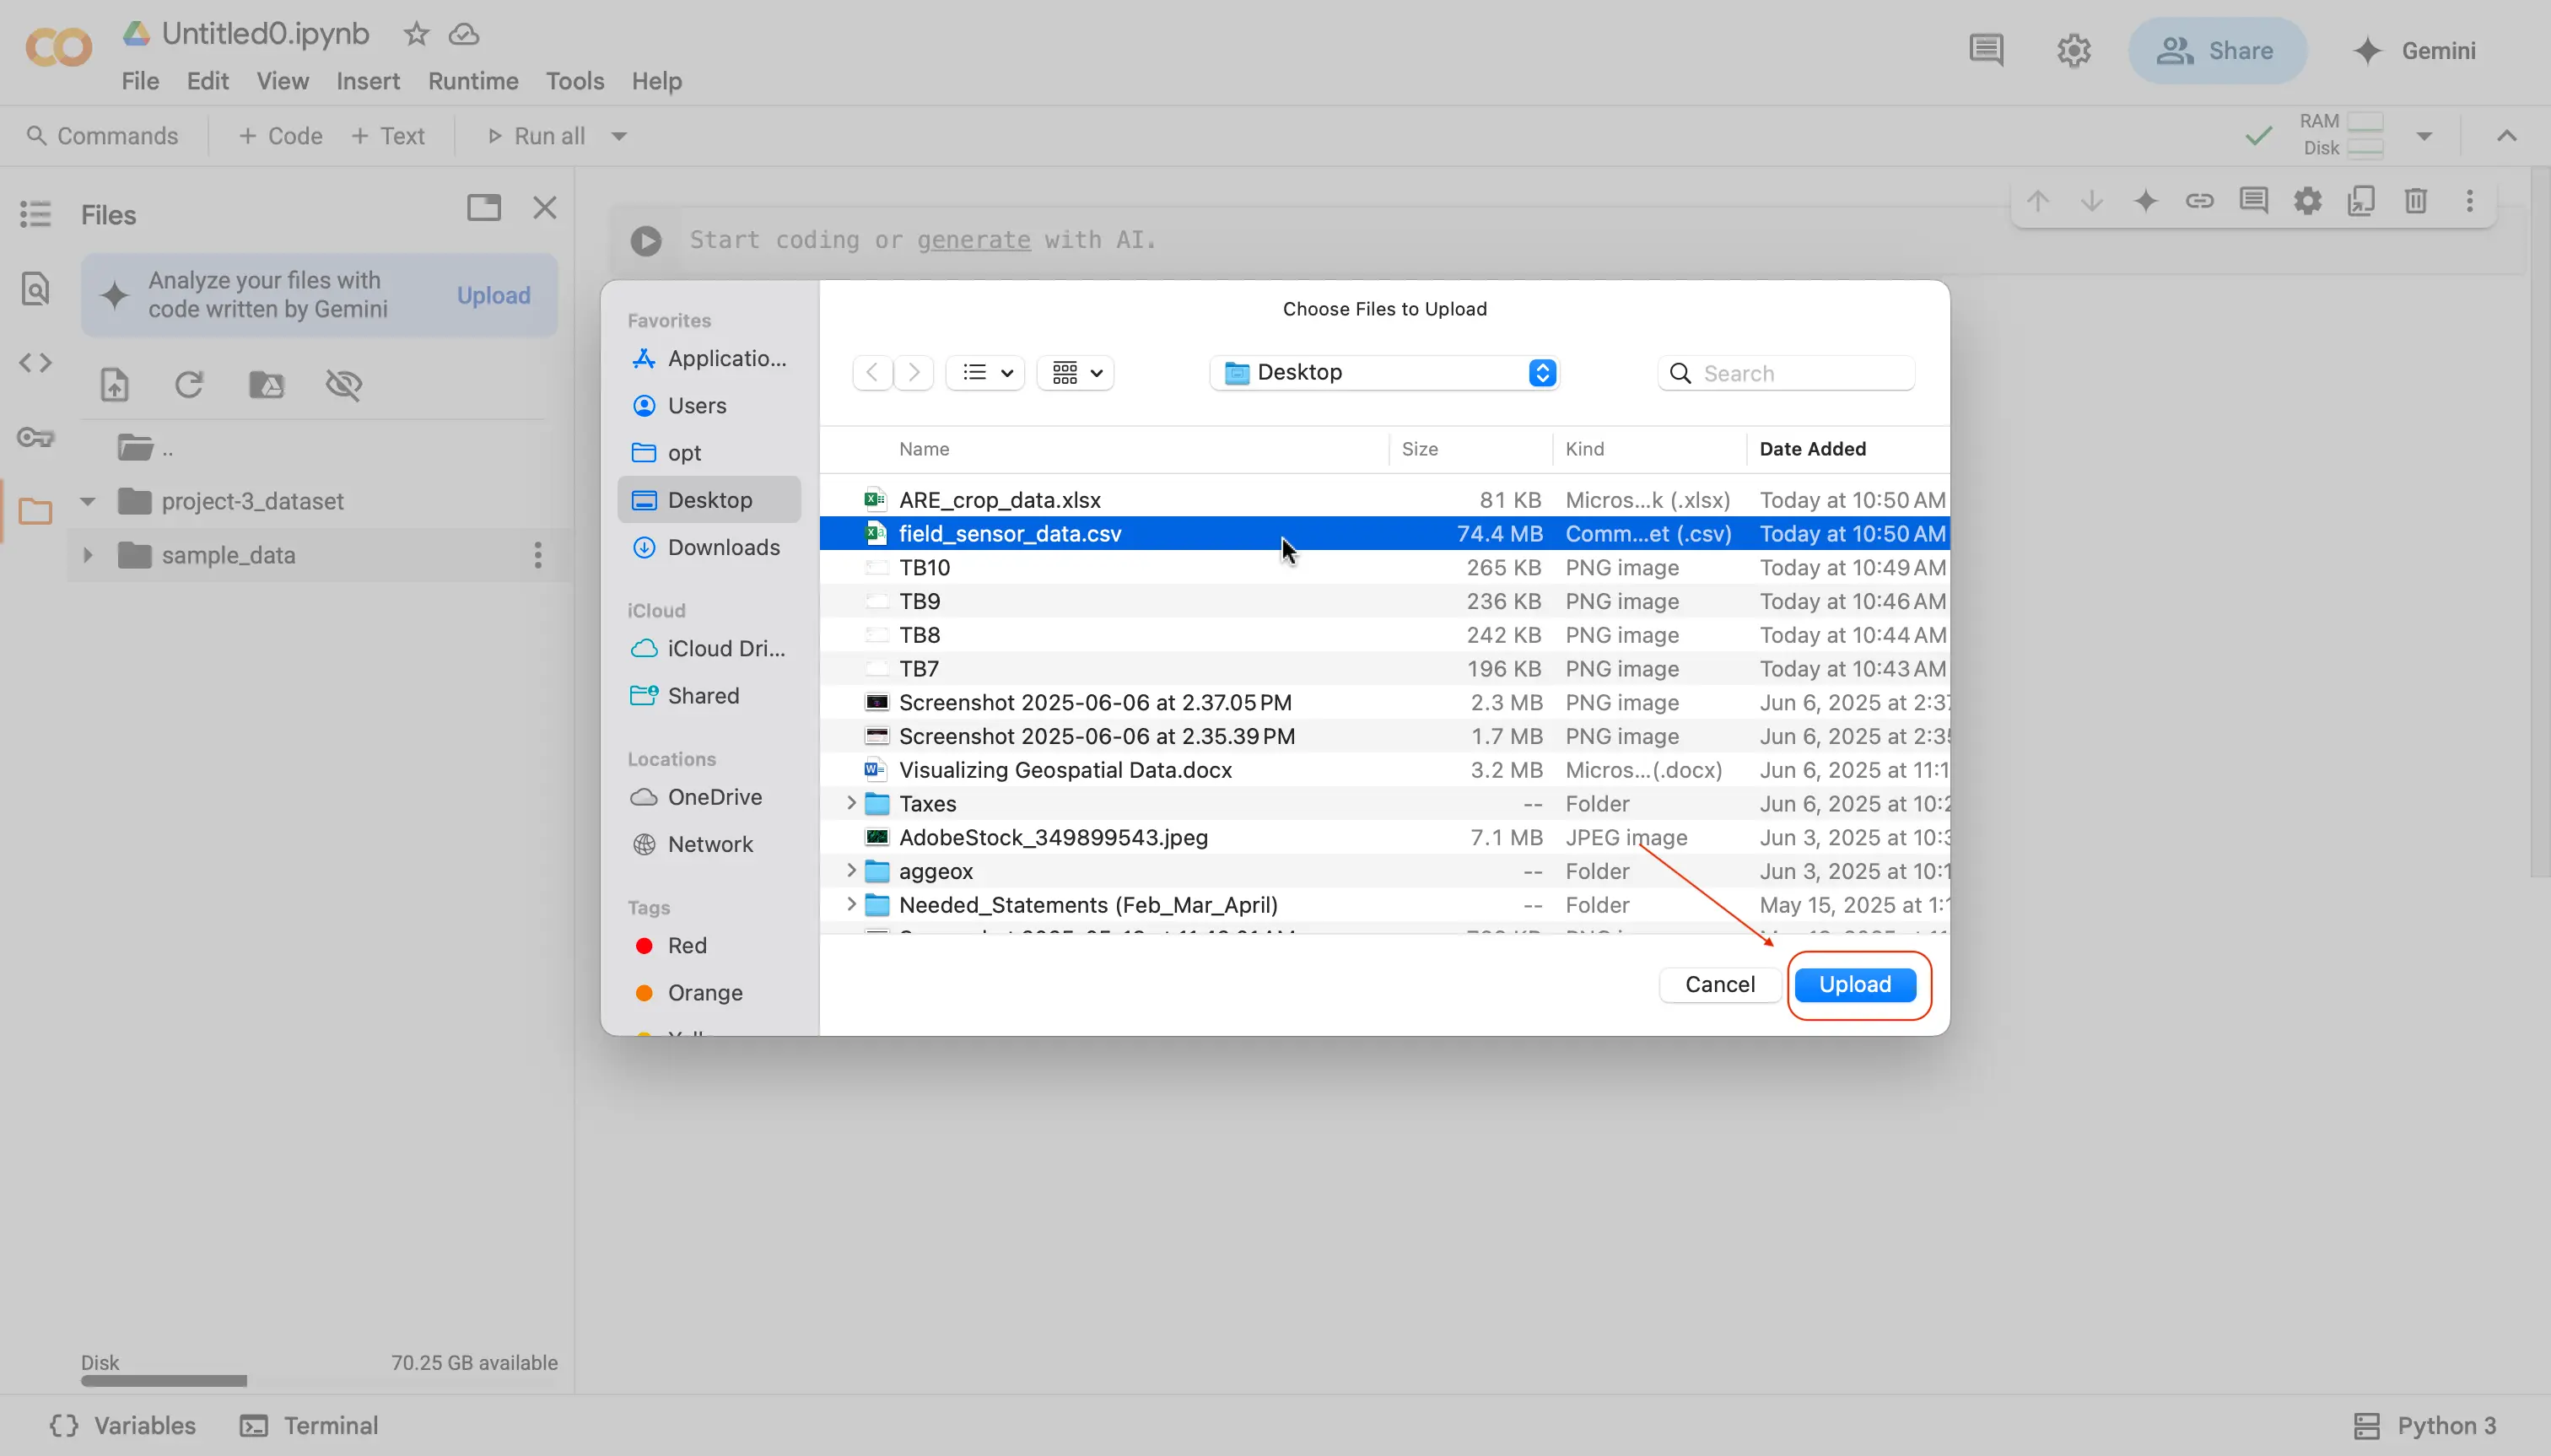
- Confirm that all three files appear in project-3_dataset.
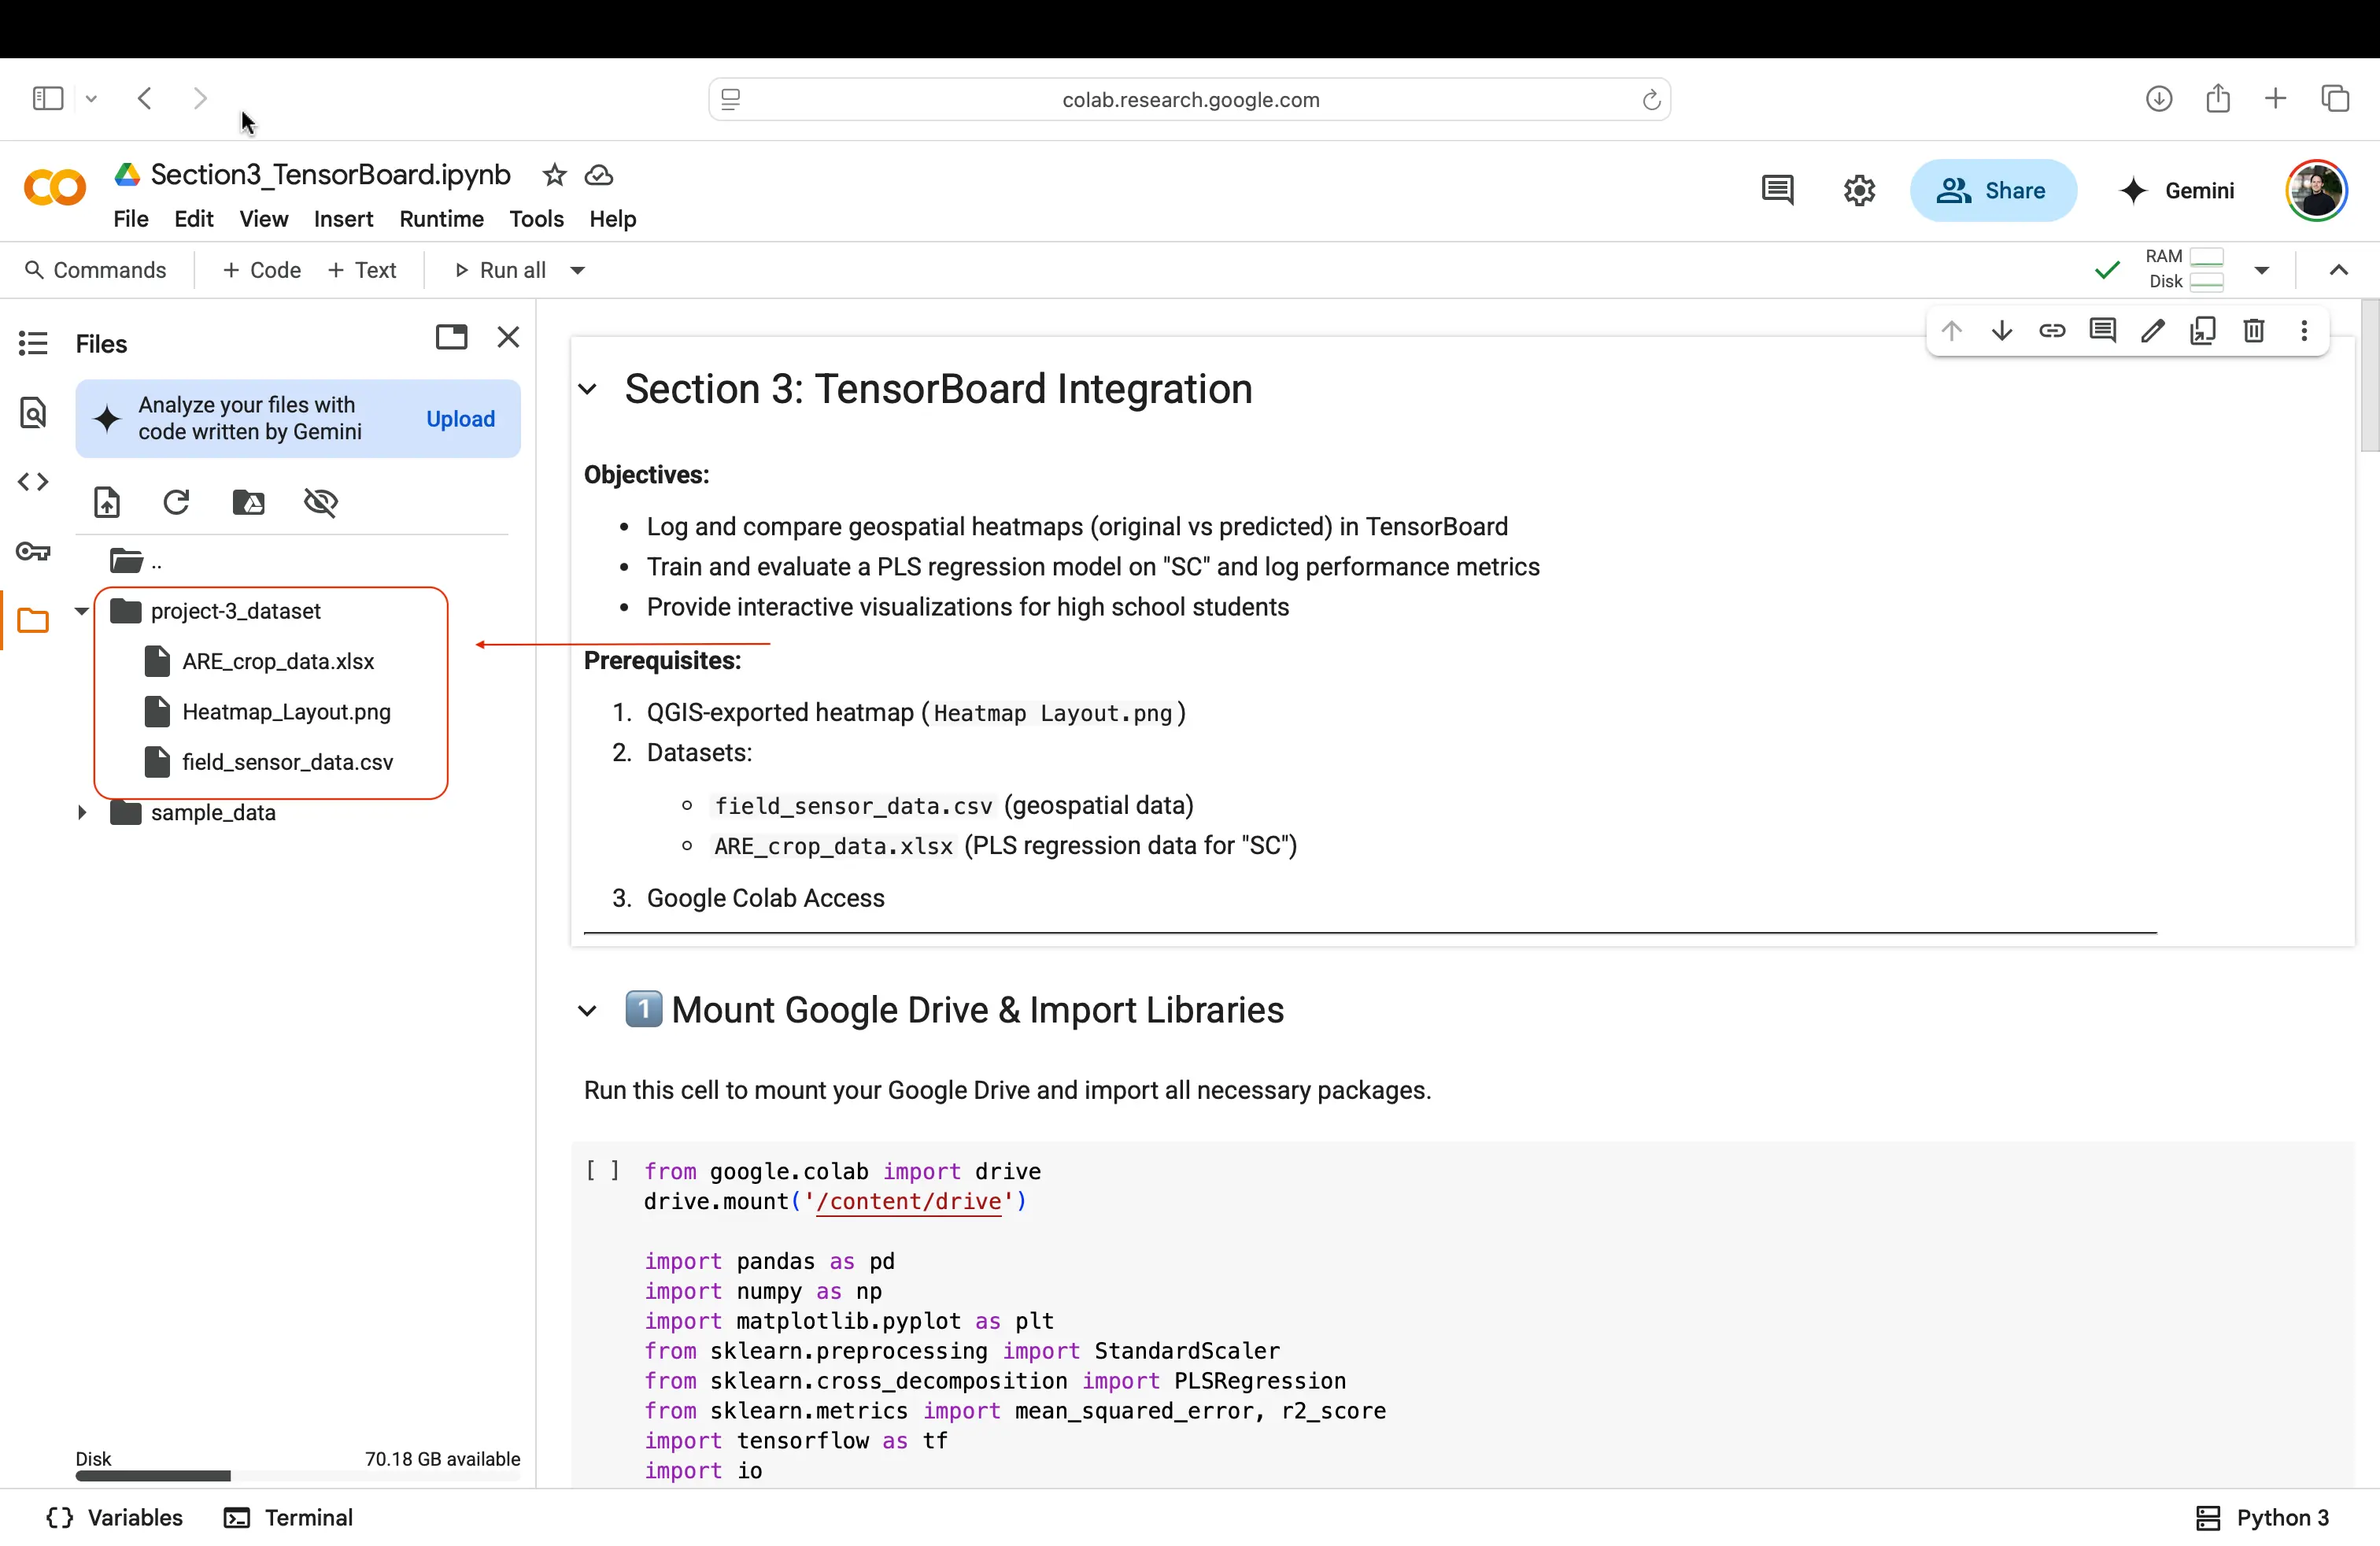
And with that, your files that you have cleaned, created, and downloaded throughout the modules, should now be accessible to use in your coding environment to run the notebook for this final module.
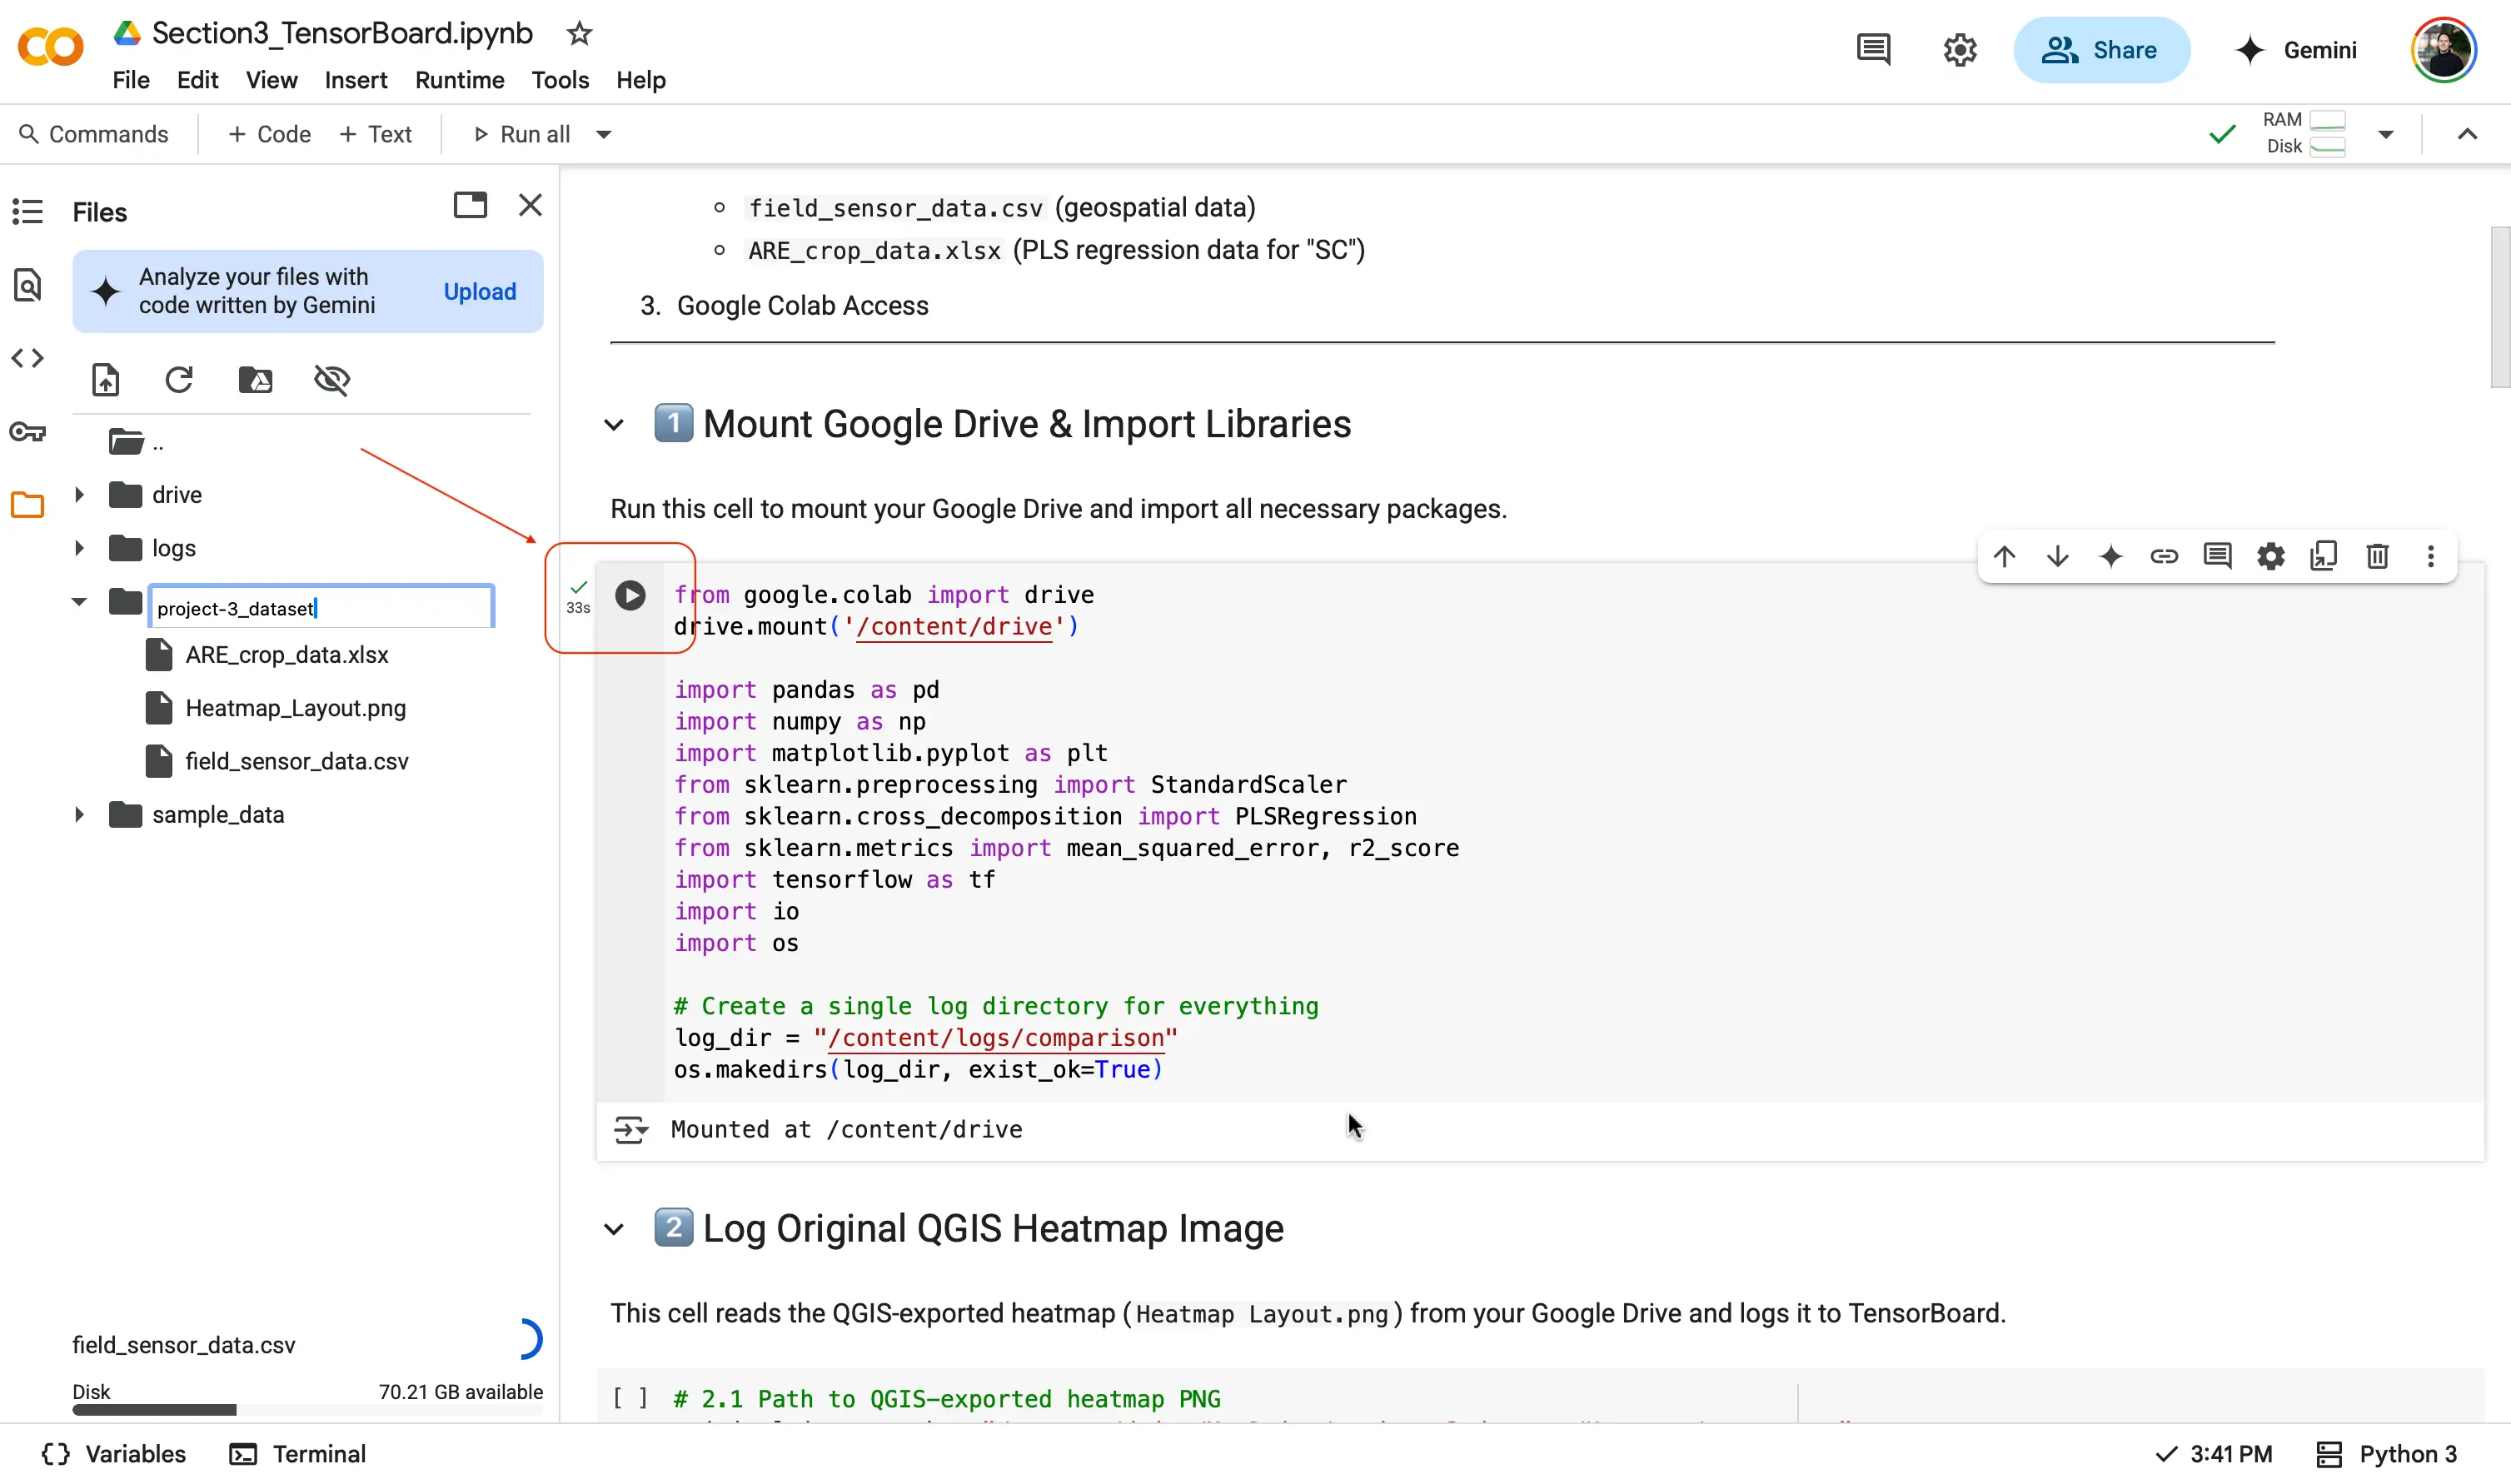
Running your Tensorboard code
The final part of the module is now reading what the code does, and running the code! Each step of the code, had a detailed remark above it as a comment, to let you know what the piece of code is doing.
Remember that when running the code, you will hit the small Play icon that is next to the code, to run it.
You should know!
When you run the very first block of code, you may see a similar pop up like this asking for permission to access your Google Drive. Allow this, so that your files that we uploaded previously, are able to been seen by the code. 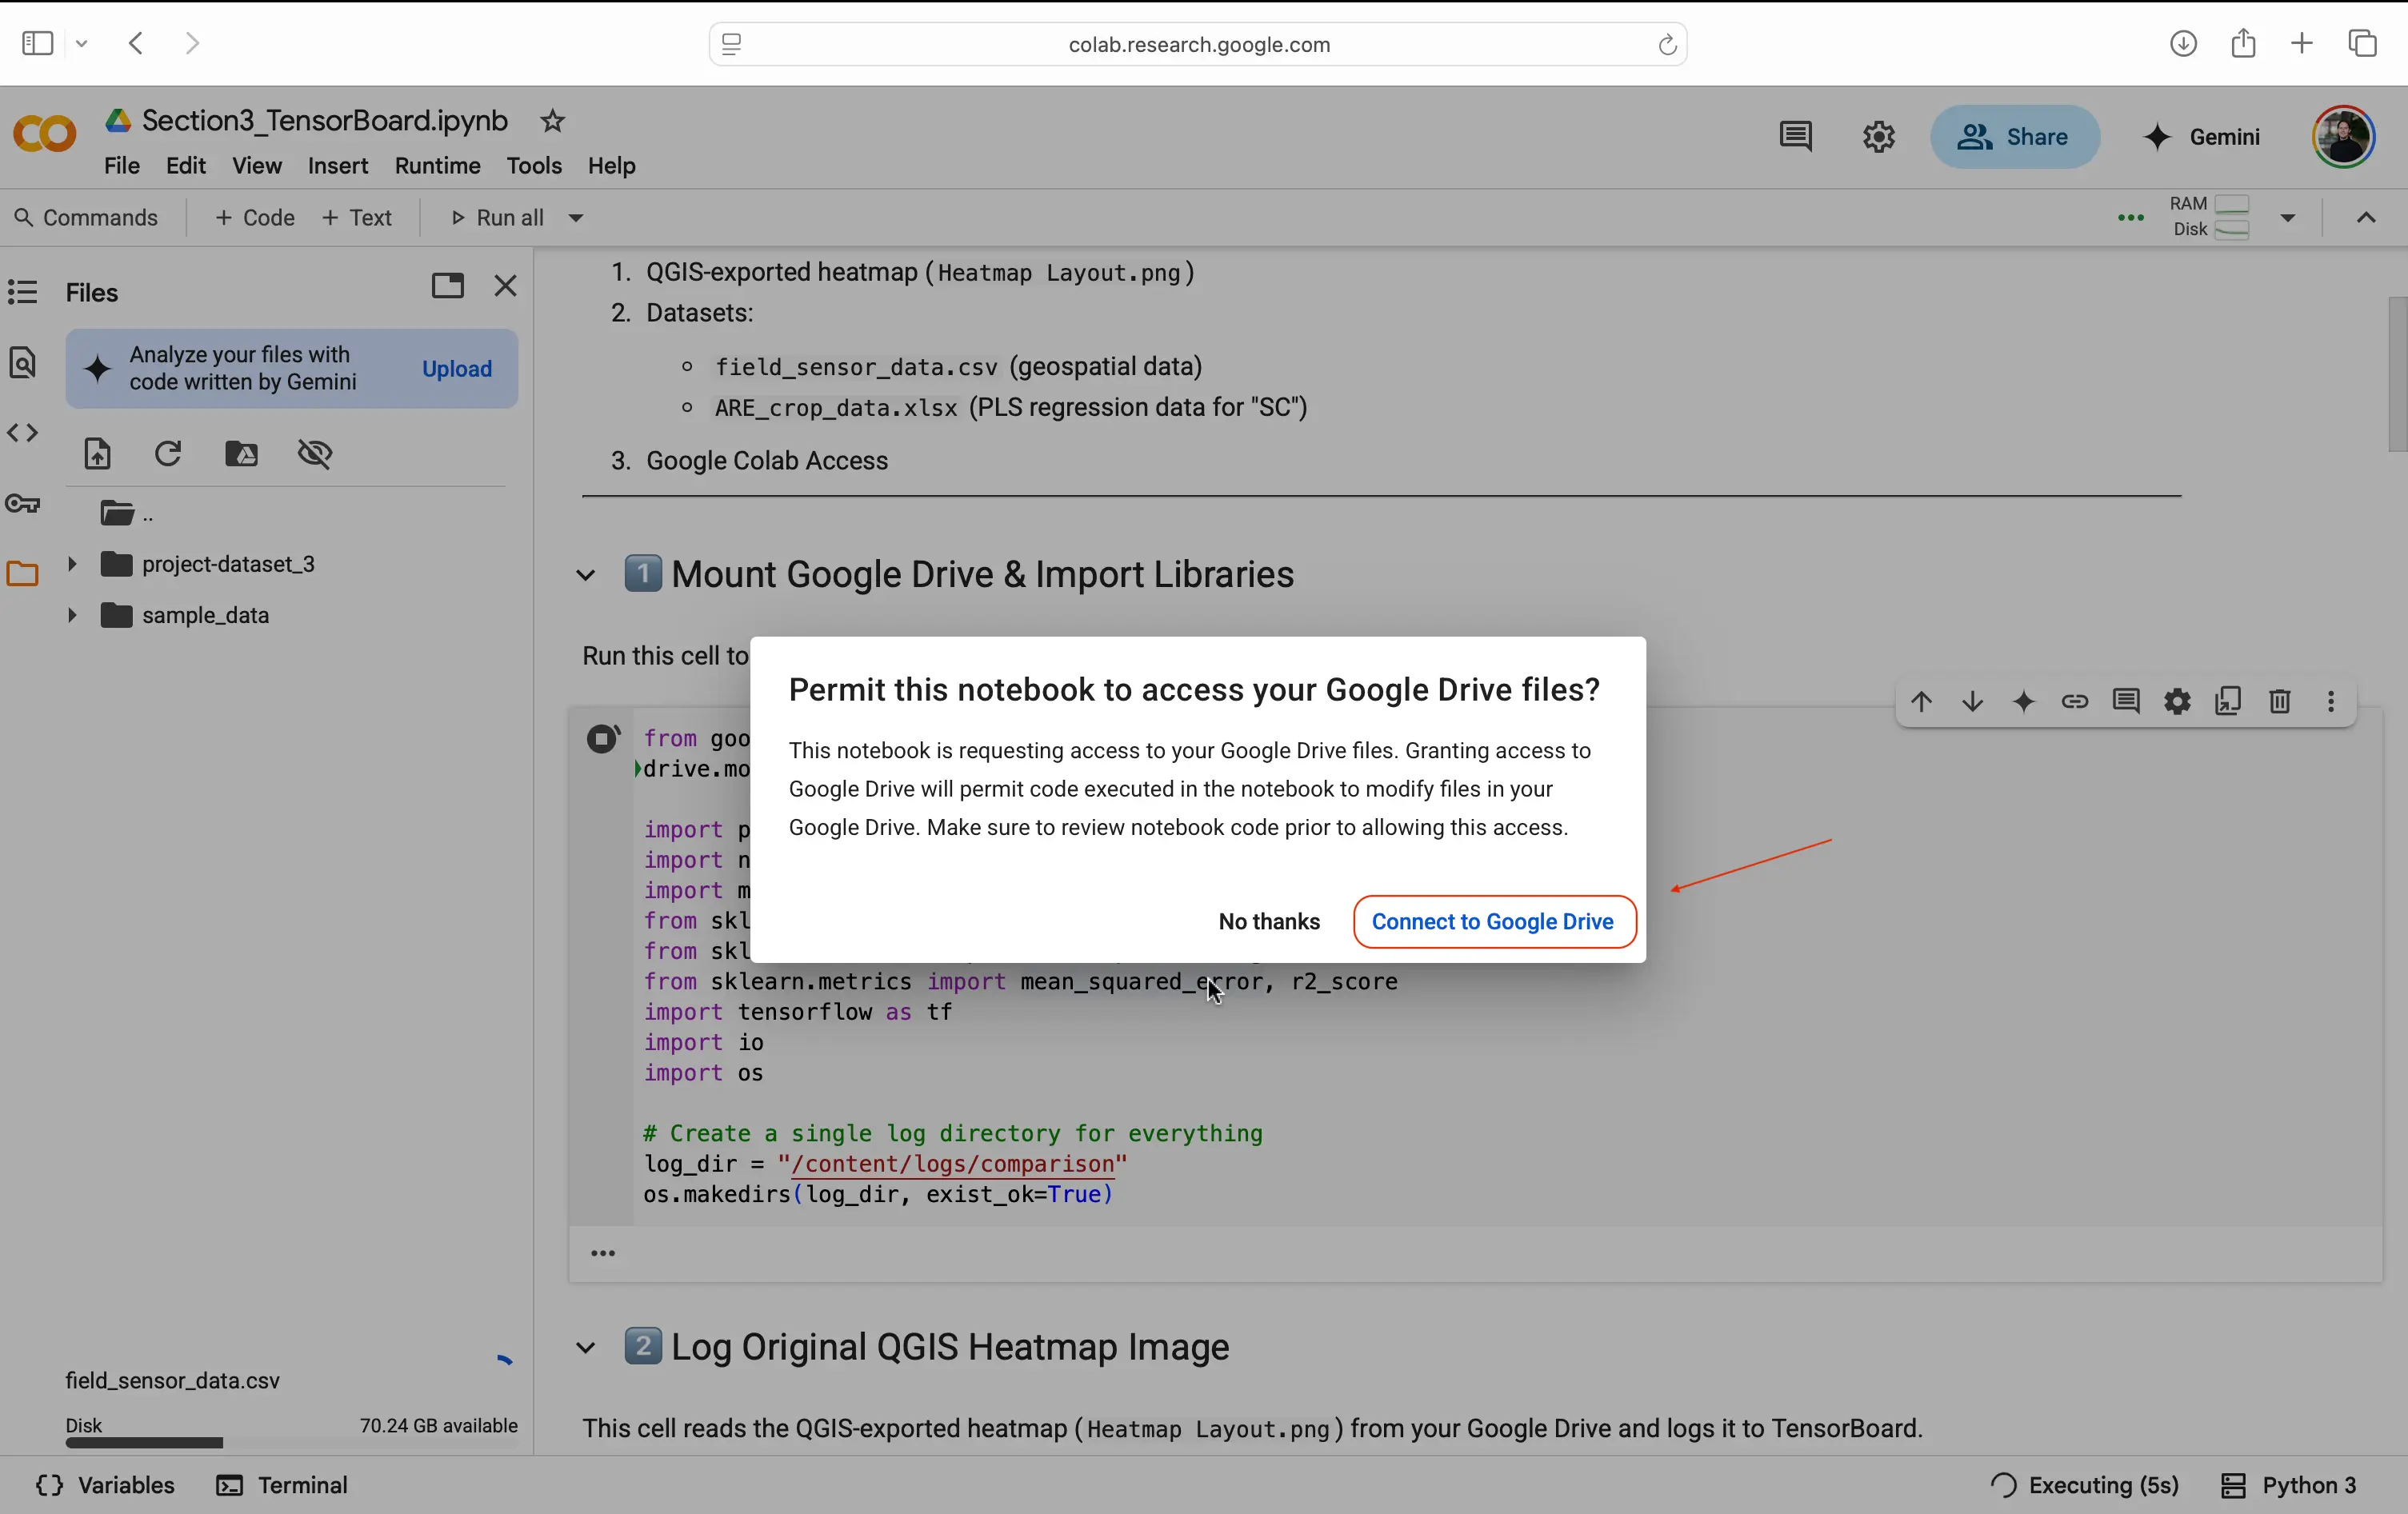
When you reach the end of the module, you will be looking for a similar result, which is Tensorboard being displayed with your data, and extra charts/visualizations being displayed with Tensorboard! 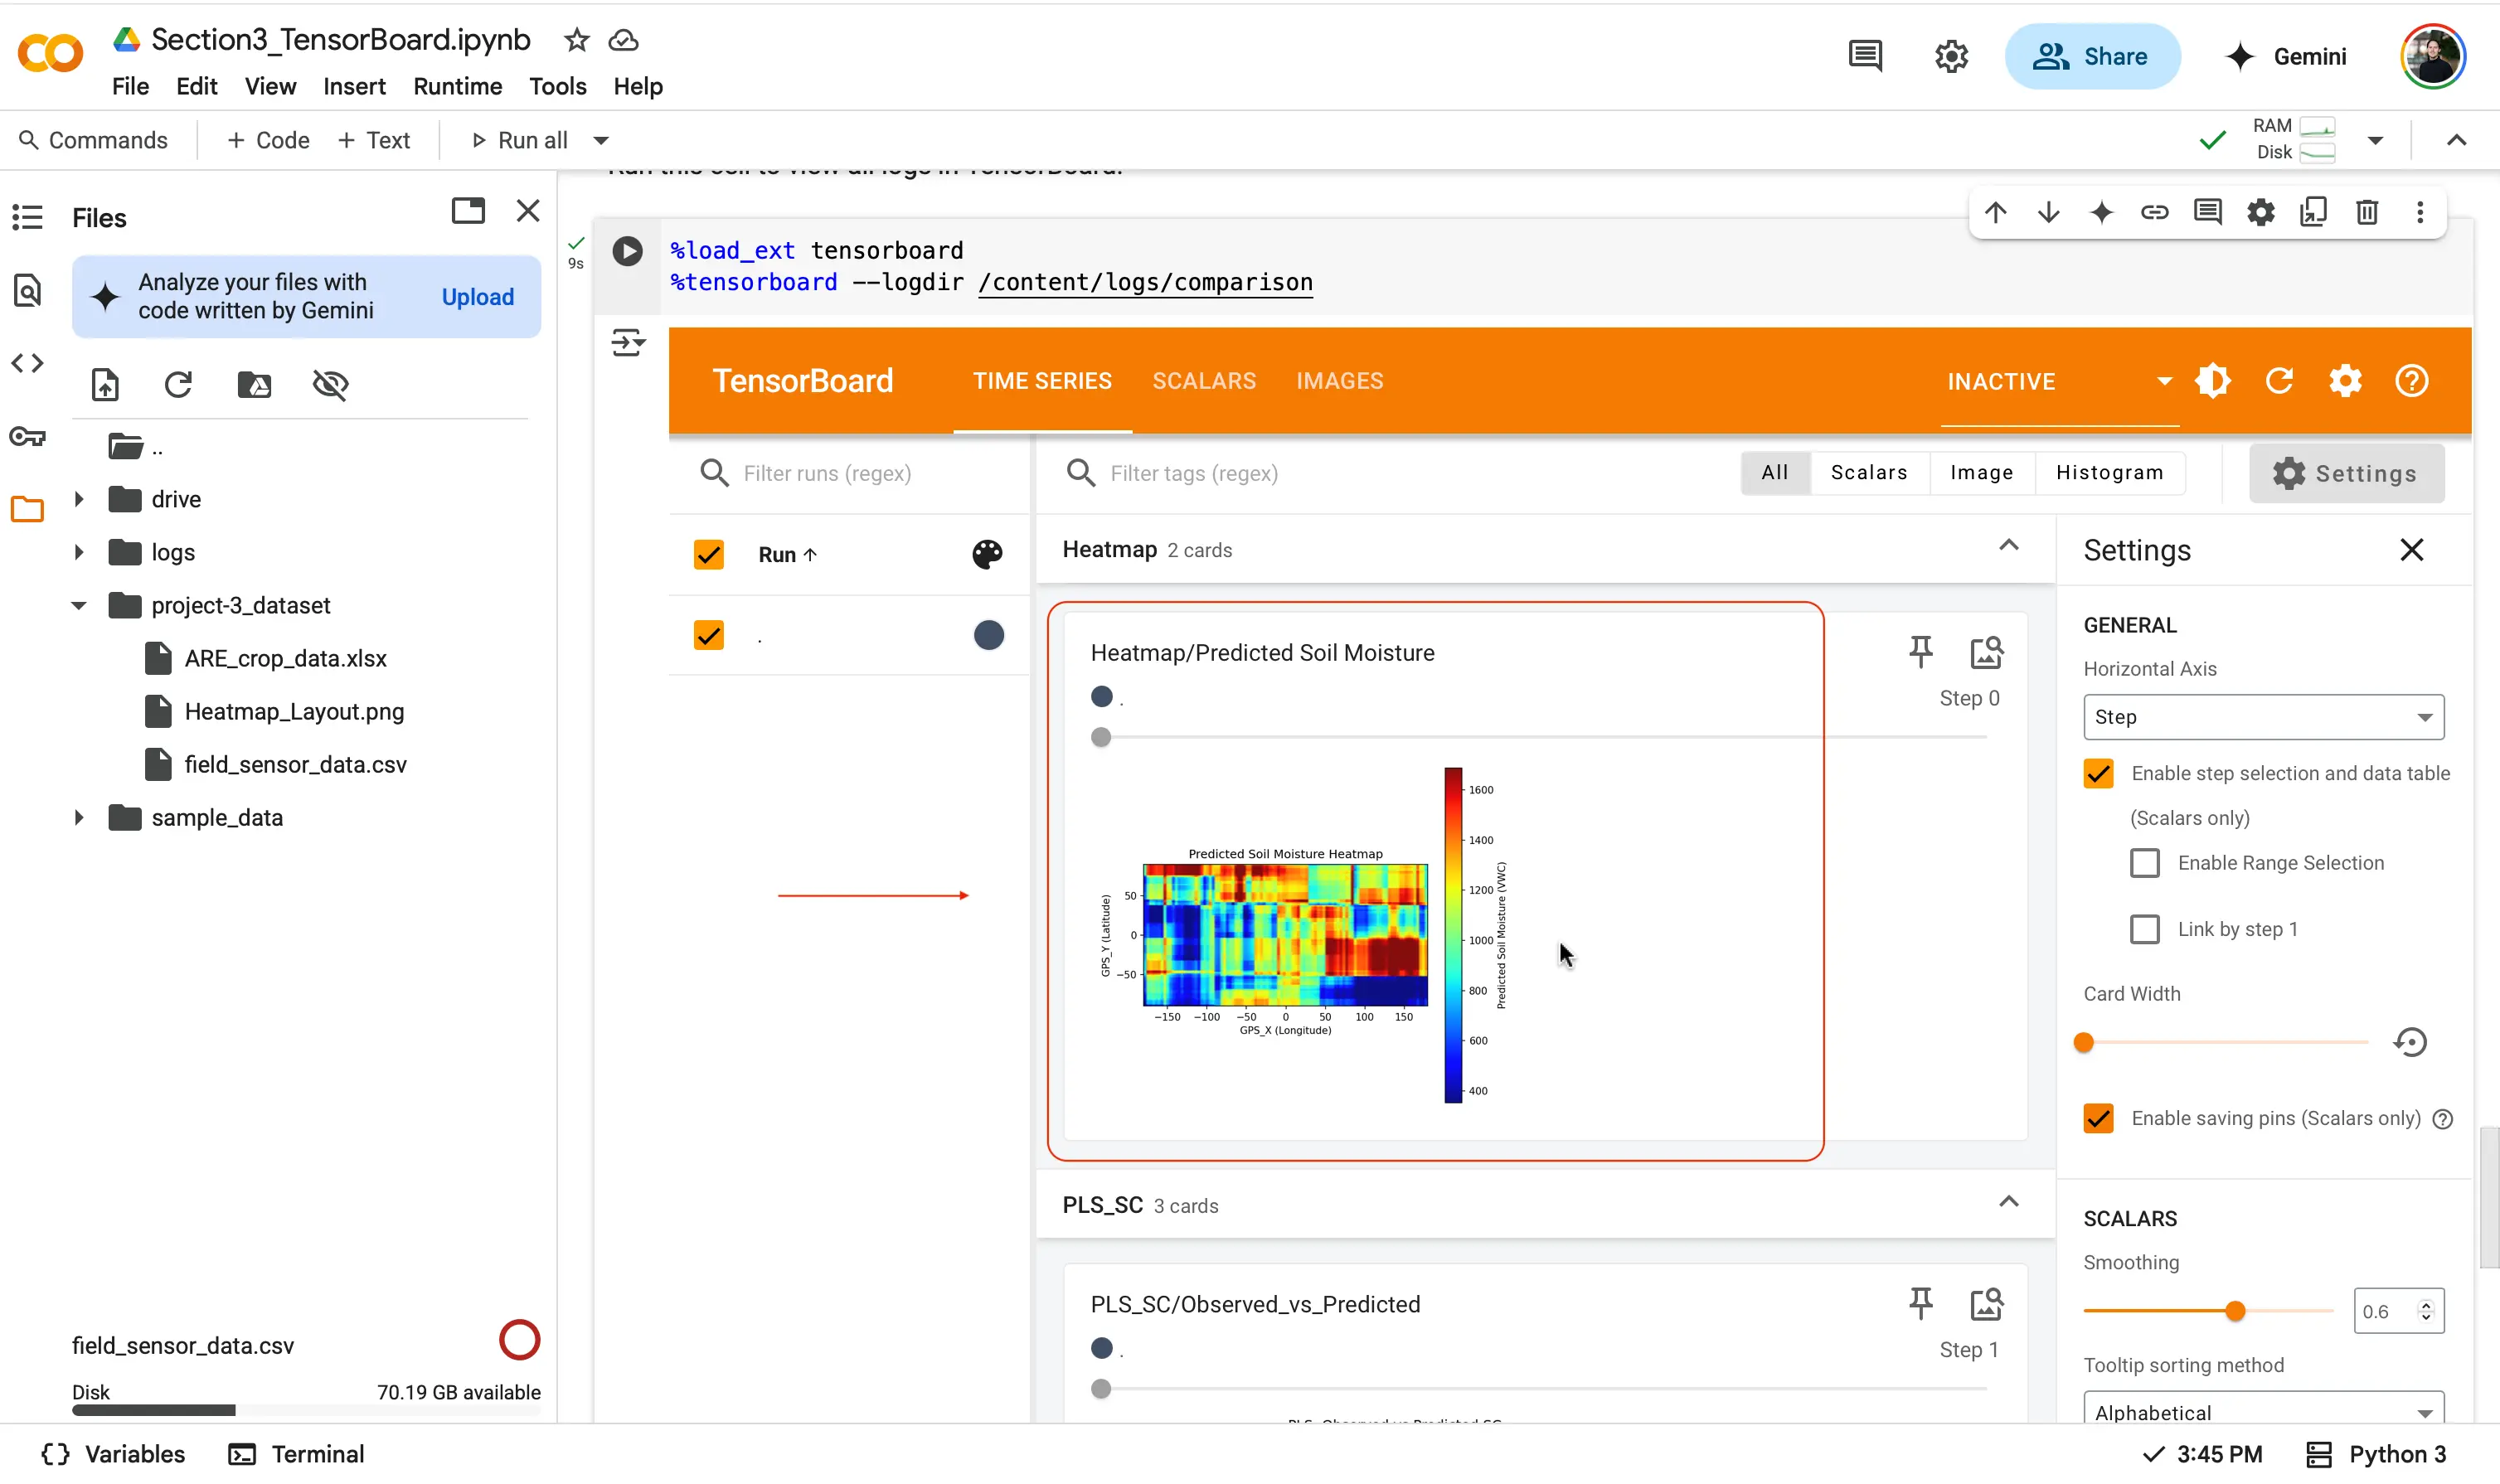
Congrats on completing the final module!
Learning Resources
Want to learn more? Checkout the links below!
Here is the main webpage to get started with Tensorboard, and start with the basics: Getting Started with Tensorboard
Check out the official github repository for Tensorboard, if you want to see the code behind how it works: Tensorboard Github Link
If you want to see how Tensorboard works with another popular machine learning library check out: How to Use Tensorboard with Pytorch
Glossary
Identified Keywords
- TensorBoard
- Machine Learning (ML)
- Visualization
- Model Training
- Feature Selection
- Prediction Evaluation
- Metrics
- Loss Curve
- Accuracy Metrics
- Geospatial Heatmaps
- Interactivity
- Data Preparation
- Framework
- Black Box
- TensorBoard: A free, browser-based tool developed by Google that helps visualize and track machine learning experiments in real time.
- Machine Learning (ML): A method of teaching computers to learn from data and make predictions or decisions without being explicitly programmed.
- Visualization: Turning data or model results into images, graphs, or charts to help better understand what’s happening during training or analysis.
- Model Training: The process of teaching a machine learning model to recognize patterns in data by feeding it examples.
- Feature Selection: Choosing which variables (or columns of data) are most important for predicting the target outcome.
- Prediction Evaluation: Checking how well a model’s predictions match the actual results, often by calculating accuracy or error rates.
- Metrics: Numbers or values that measure how well a model is performing (e.g., accuracy, loss).
- Loss Curve: A graph that shows how much error the model is making as it learns over time—lower is usually better.
- Accuracy Metrics: Measurements that show how often a model gets the correct answer.
- Geospatial Heatmaps: Colorful maps that show how data (like crop traits or model predictions) vary across space or location.
- Interactivity: The ability to zoom, scroll, and click around in visualizations to explore data more deeply.
- Data Preparation: Cleaning and organizing raw data into a format that can be used by a machine learning model.
- Framework A set of tools and libraries that make building software or machine learning models easier.
- Black Box: A term used to describe models or systems that are hard to understand because you can’t see what’s happening inside them. TensorBoard helps make the "black box" more transparent.