

Introduction
Getting Started
Installation
Step-by-step guide to setting up your project and installing the needed dependencies.
Concepts guide
Explore geospatial concepts, their applications, and their role in modern science.
Begin Project
Jump right in, and begin your project! There are three sections to complete.
Contributing
Contribute ideas, modules, and suggestions to improve our learning materials.
Introduction
Welcome to the Shakoor Lab's Geospatial Science learning project! We have created this guide that will help students like you to set up your learning environments, create heatmaps using QGIS (a geospatial data software) and Python (a popular programming language), and visualize real sorghum research field trial data while developing data science and machine learning skills. We’ll walk you through how to build a predictive model for important plant traits (e.g., yield, seed protein content, and chlorophyll a fluorescence) using data from drones, field instruments, technicians, and climate records.
You should know!
Machine learning is a branch of artificial intelligence that enables computers to automatically learn patterns and make predictions or decisions from data without being explicitly programmed.
You’ll also learn to track and interpret metrics such as preprocessing steps, hyperparameter tuning, and feature importance, by installing and using the visualization tool TensorBoard. By following these instructions, you’ll be prepared to analyze geospatial data and apply machine learning techniques to understand plant performance more effectively.
Technology Behind the Science
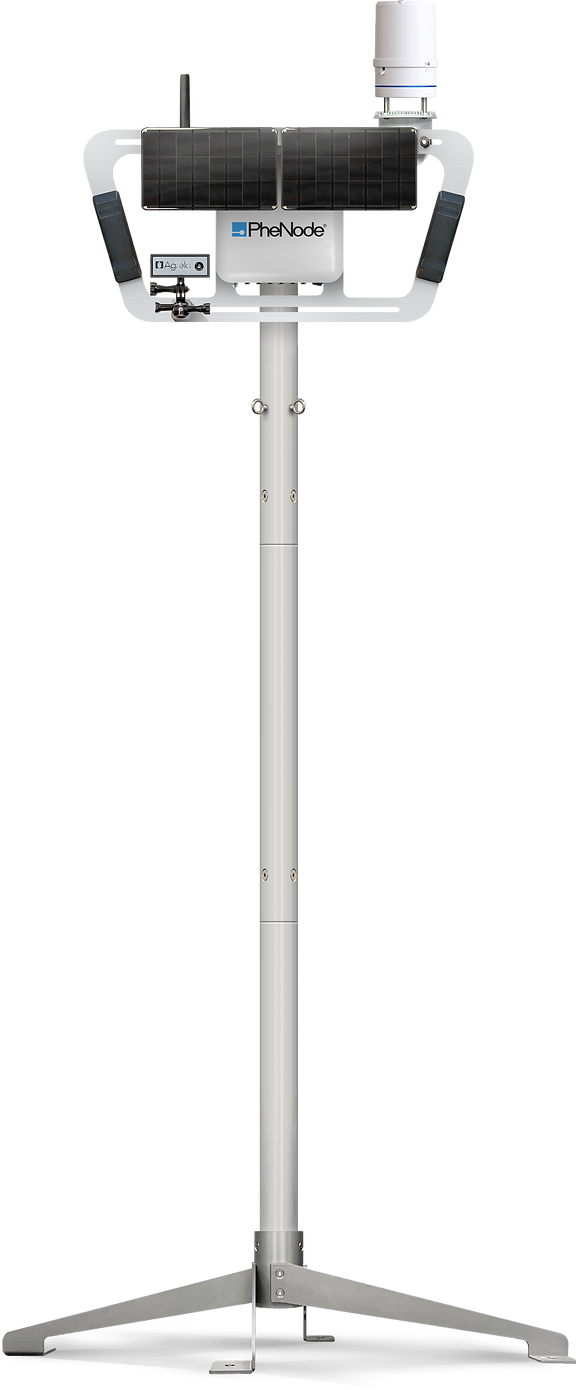
Phenode
Throughout this activity, you will be using real data collected from our field trials! A lot of this data comes from manual collection from our team of research technicians, but also from wireless sensors and weather stations! Two pieces of technology used in this data collection is the Phenode, and it's Wireless Sensor Network (WSN). The Phenode is built out of an Saint Louis based startup company called Agrela Ecosystems!
PheNode is a scalable, environmental sensor platform that encourages innovation by providing users the freedom to build custom solutions tailored to their unique needs. It collects a vast array of atmospheric data that was used in the data for this activitiy, such as precipitation, windspeed, wind direction, and temperature.
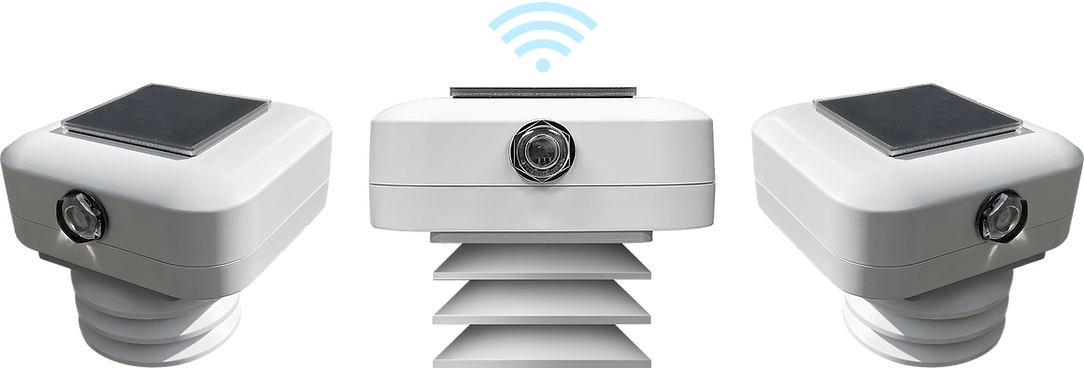
The Wireless Sensor Network is how we get to collect data metrics such as soil moisture, salinity, and electrical conductivity. The wireless sensors can communicate up to 1km away and increase our measurement area by 500+ acres with a single PheNode! These battery-operated, solar-powered sensors are placed in representative areas in the field remotely collect data throughout the growing season. The data is then transmitted hourly to the PheNode via LoRaWAN or Bluetooth communication.
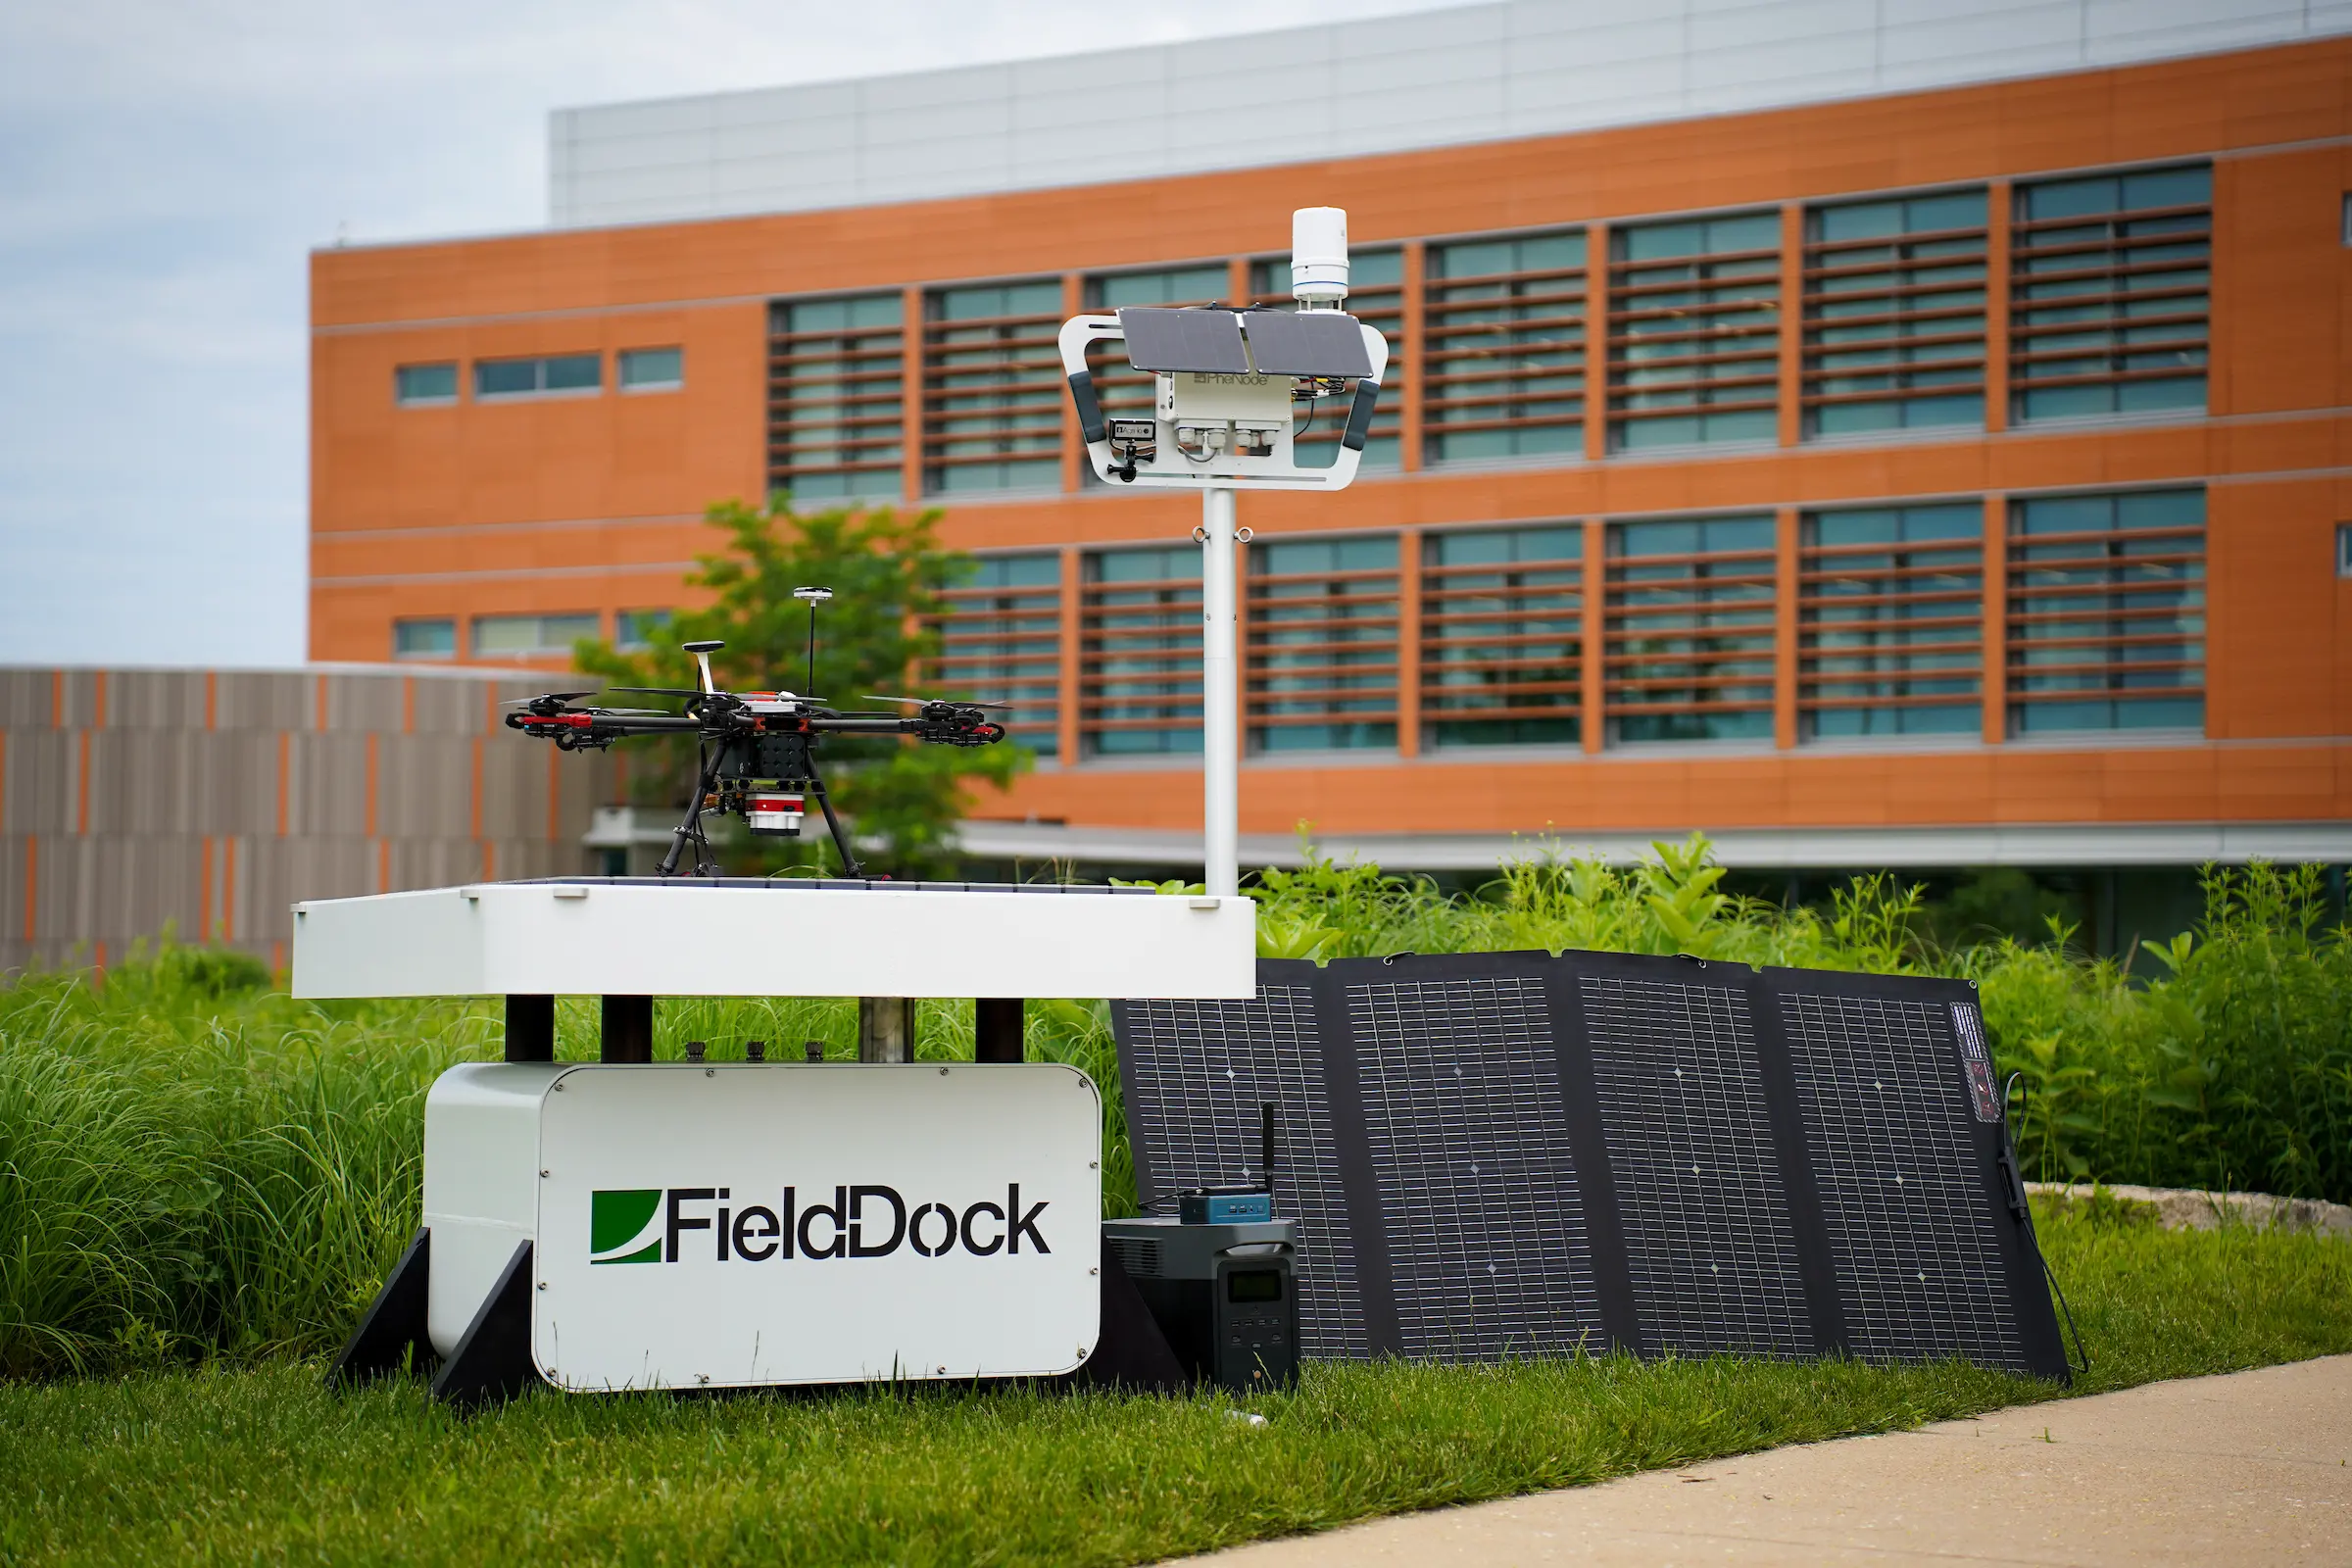
FieldDock
Much of the data was also collected with an in house system our team is building here at called the FieldDock! In summary, FieldDock is an all-encompassing system that integrates advanced technologies such as sensor base stations, edge processors, remote wireless sensor networks, and autonomous UAV drones. The idea is that it is supposed to work in harmony with technologies like PheNode, to provide scientists a wide array of data!
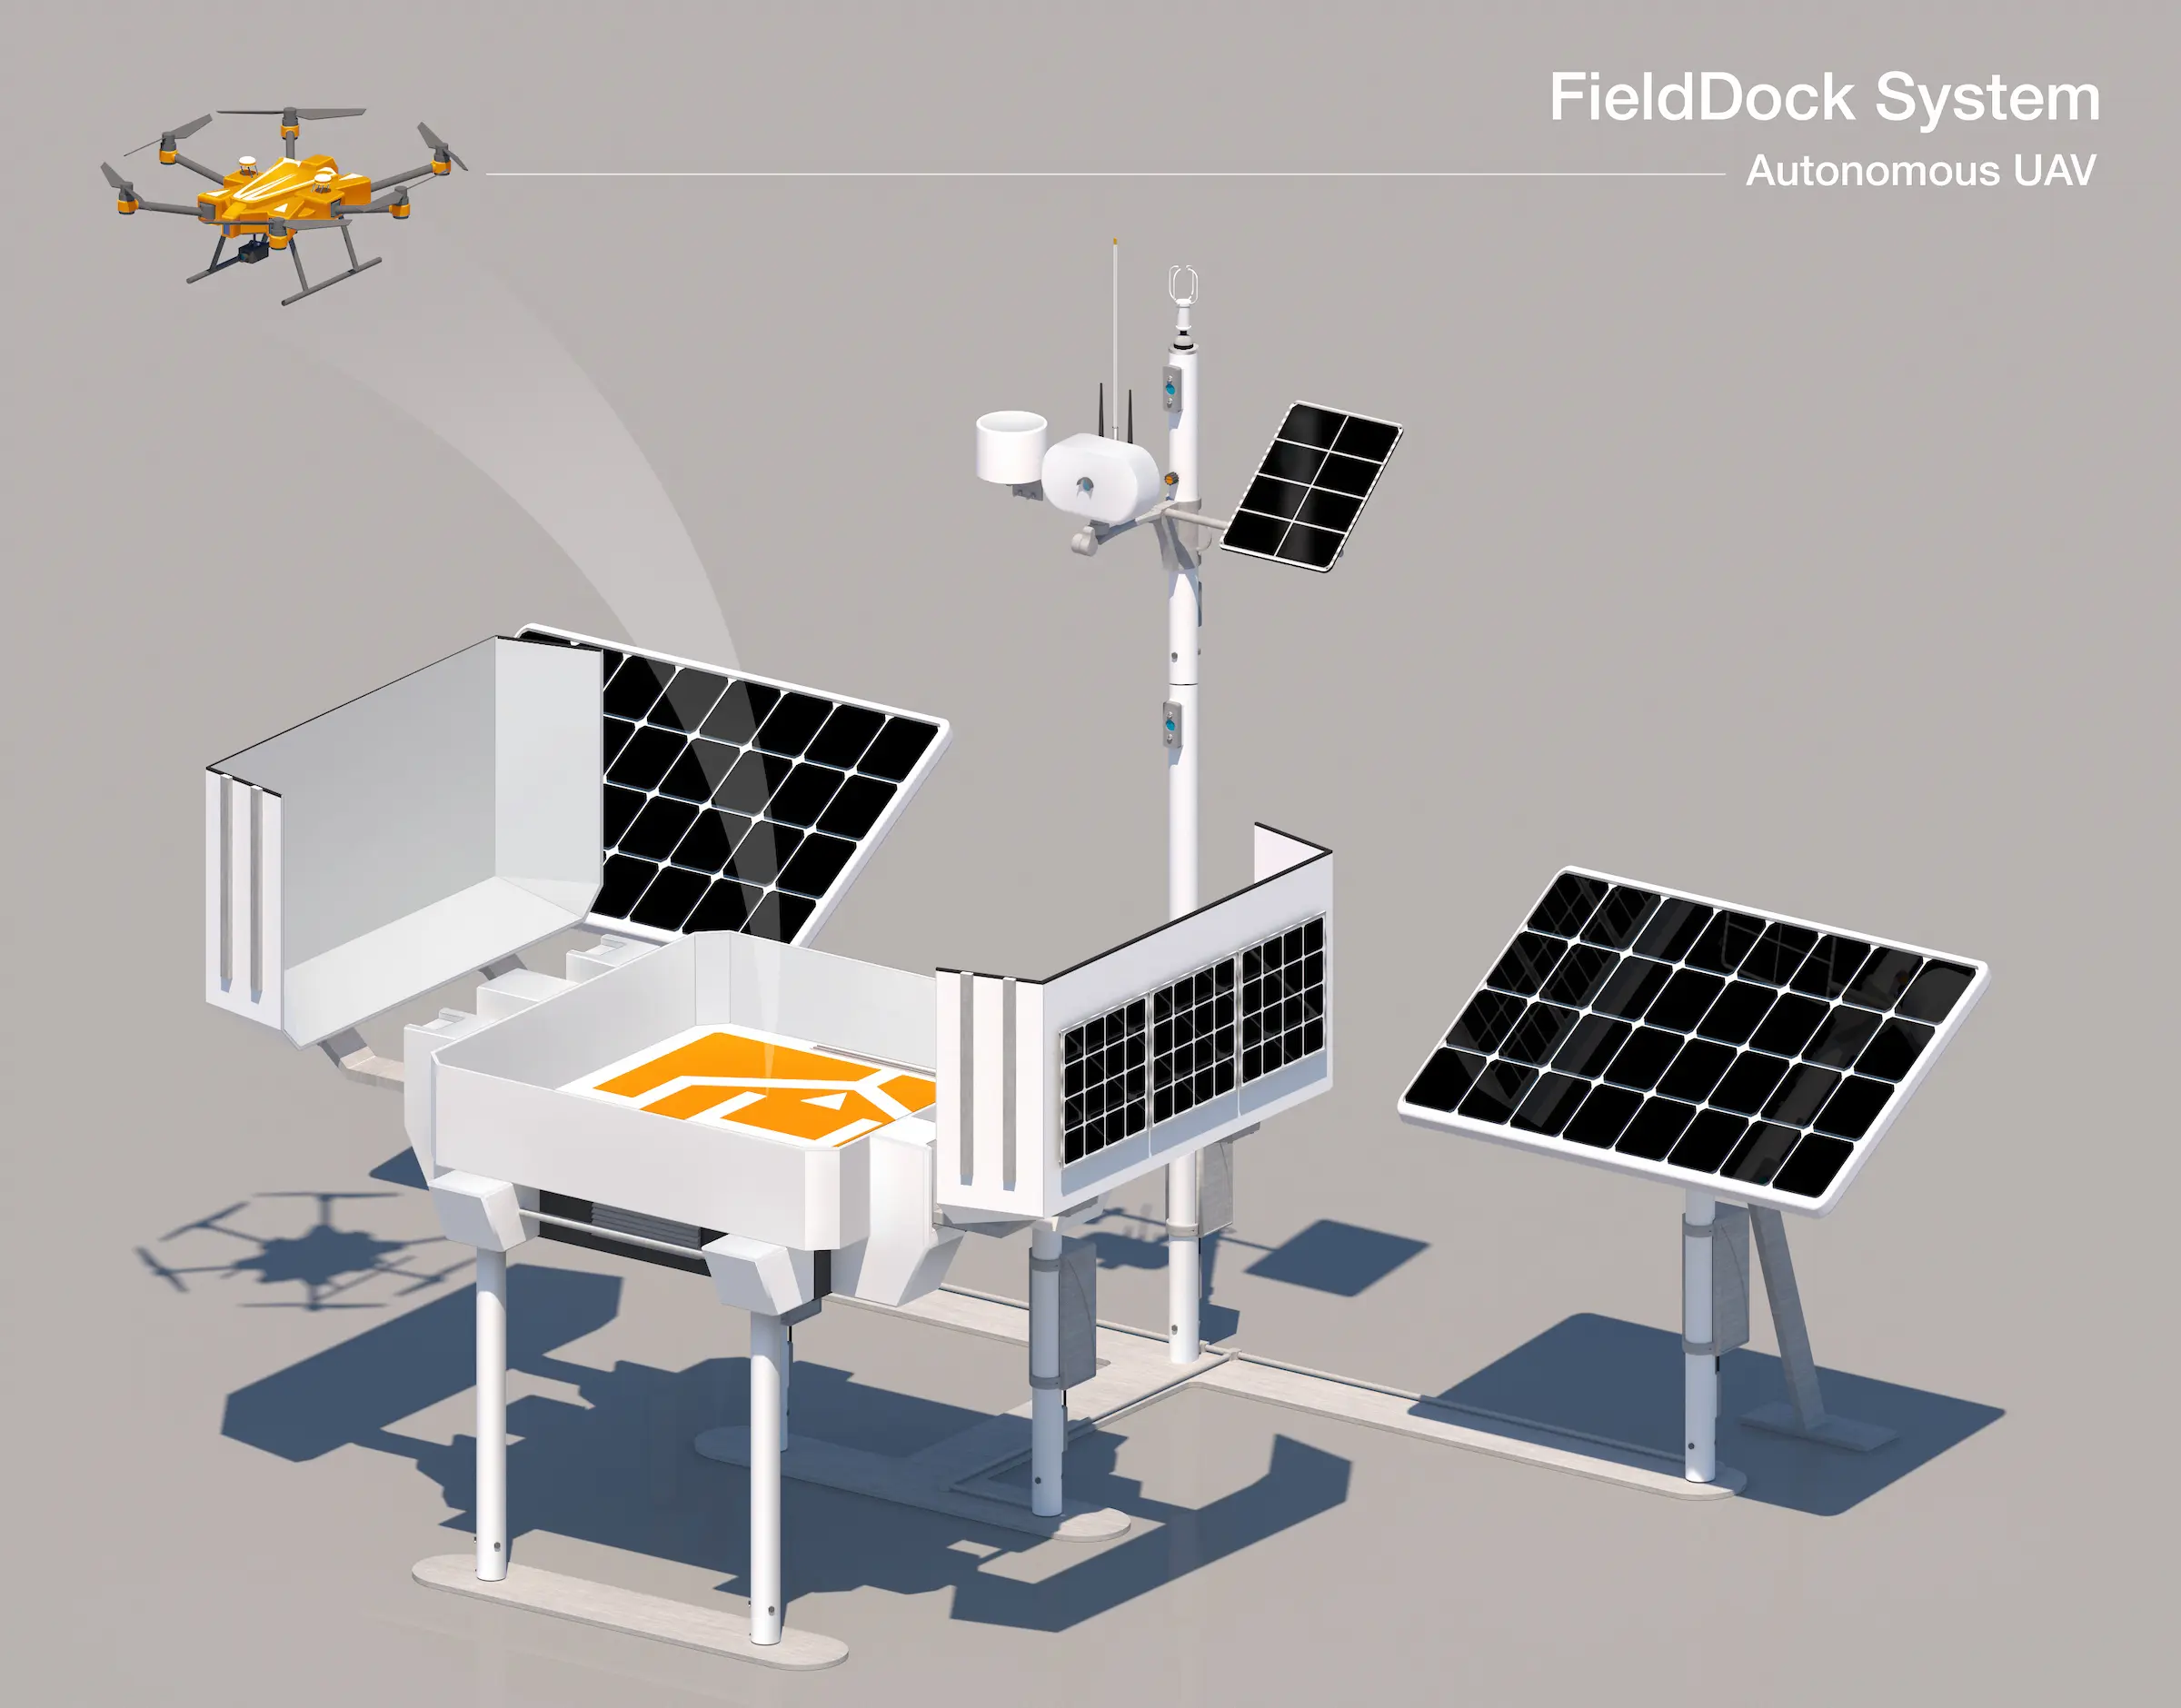
FieldDock's mission is to provide researchers, breeders, and farmers with a dynamic tool that accelerates crop improvement while reducing the need for traditional inputs like water, fertilizer, and energy. By harnessing renewable energy, FieldDock aims to operate with a zero-carbon footprint, aligning with global sustainability goals.
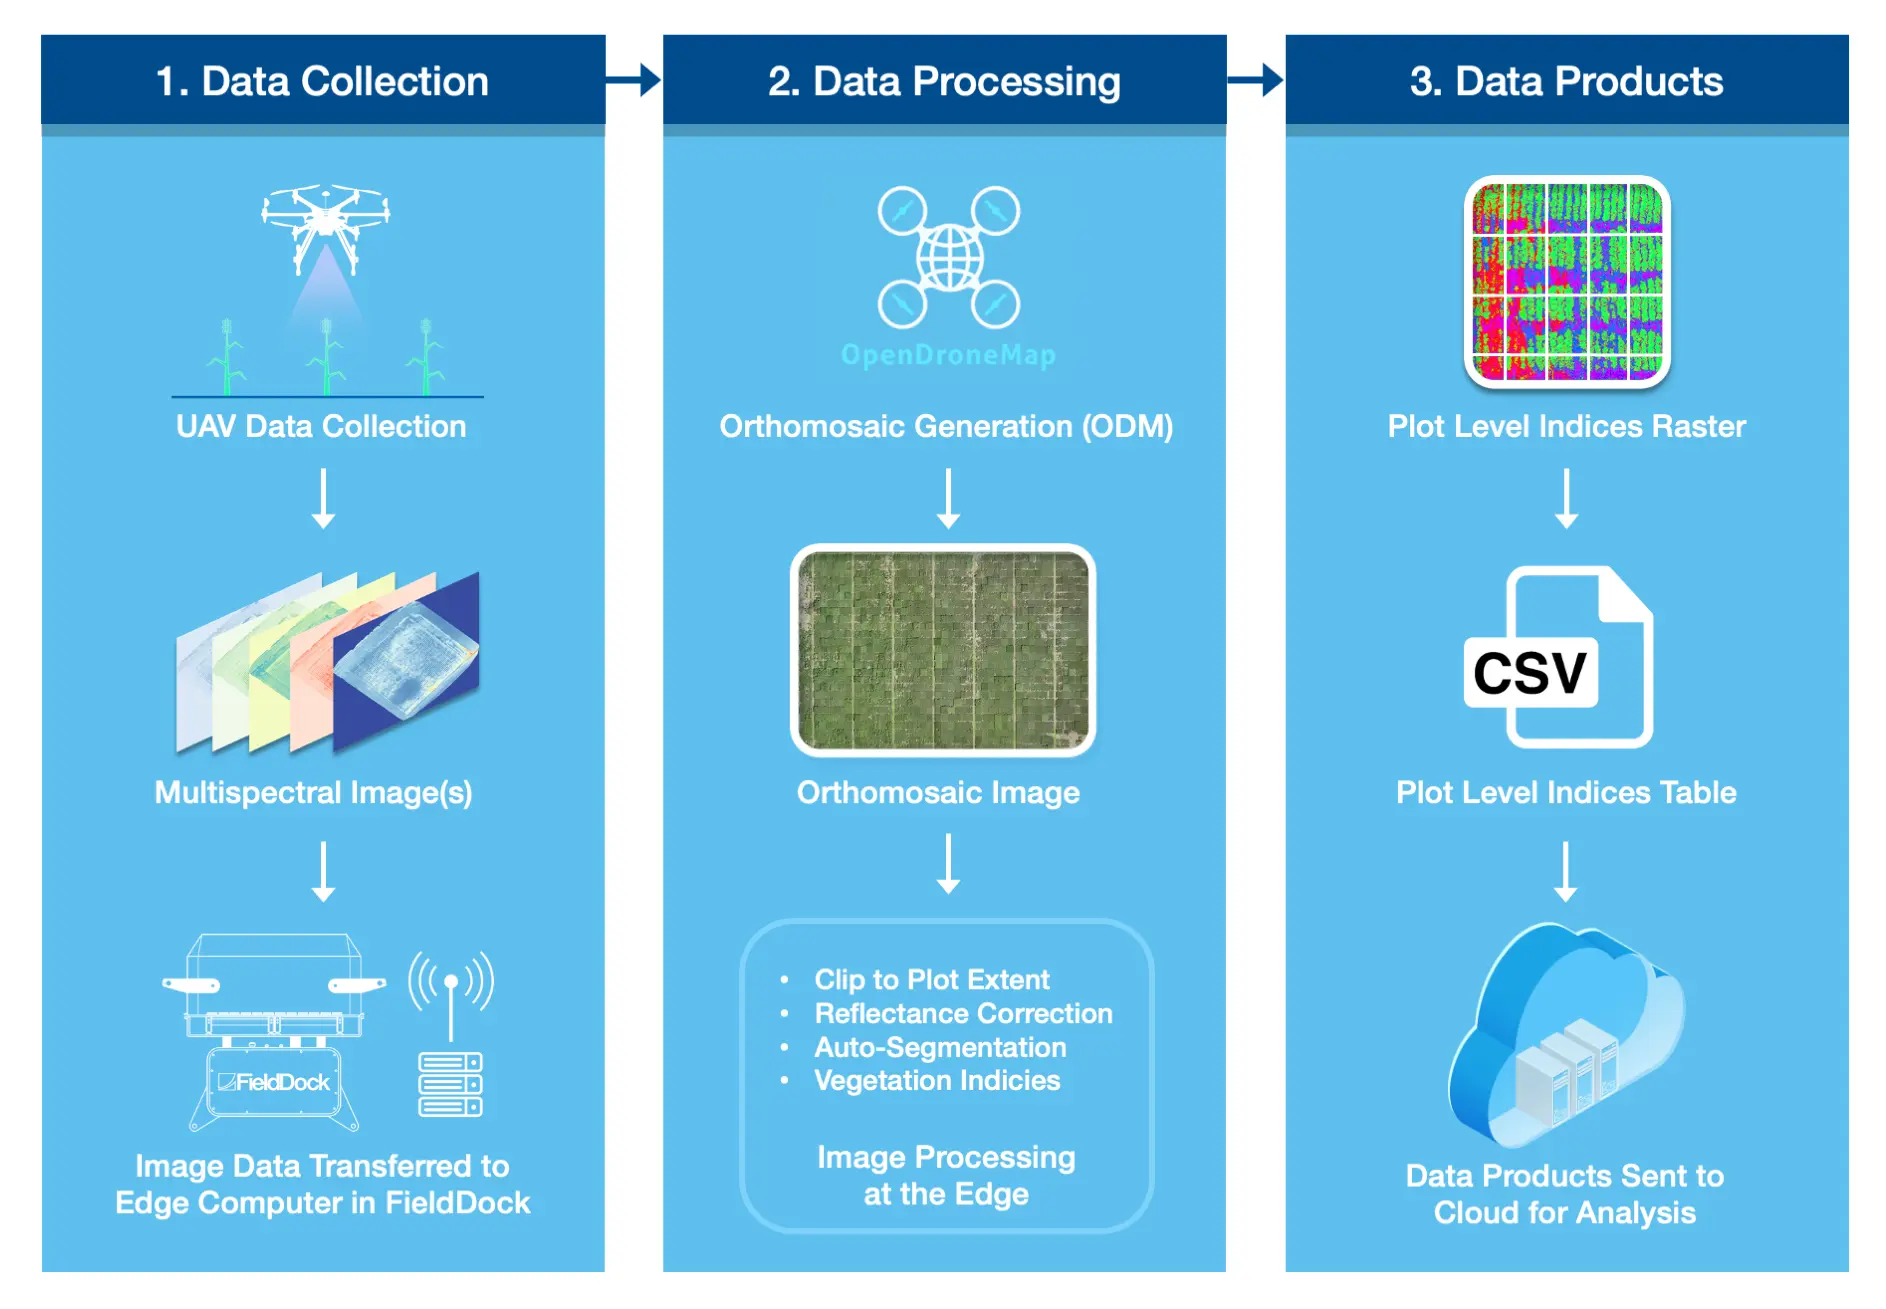
The FieldDock plays a very crucial role in our lab's ability to utilize geospatial technology in agriculture. Please see the Core Concepts to learn more about geospatial concepts and science!
Before You Begin
Make sure that before you begin the lessons, you form teams of 2-4 students and inform your educator of your team name! This is an important step because there is a competition at the end of the project to see who can produce a model with the highest accuracy. Good luck!
What You Will Learn
- Geospatial Concepts: Understand the fundamentals of geospatial data, Geographic Information Systems (GIS), and their applications.
- Data Preparation: Learn how to clean and preprocess data for analysis.
- Modeling and Predictions: Using machine learning, implement and evaluate regression models to predict plant traits like yield or protein content.
- Tool Proficiency: Gain hands-on experience with coding environments like Google Colab, and programming languages like Python.
You should know!
Understanding geospatial concepts requires curiosity and patience. Don’t hesitate to revisit fundamental topics if you feel stuck.
Prerequisites
Before starting this project, ensure you have access to the following:
Tools and Software
- A stable Wifi/Internet Connection: Make sure you have access to a good wifi network to be able to access the internet.
- Internet browser of choice: We will be accessing an online coding environment, so have your preferred internet browser downloaded.
- Google Colab: We will be accessing this platforms for running Python scripts and notebooks, via the internet.
- Excel or CSV Editor: To view and manage the data files we will be working with.
Project Overview
This project focuses on:
- Setting up your environment for data analysis, creating heatmaps with QGIS and Python, and visualizing sorghum field trial data.
- Developing a predictive model to estimate plant traits—such as yield, protein content, or chlorophyll fluorescence—using data from drones, field instruments, technicians, and climate records.
- Installing and using TensorBoard to log, track, and visualize various metrics (e.g., preprocessing steps, hyperparameter tuning, and feature importance) throughout the modeling process.
Data Sources
You will work with:
- Wireless sensor data
- Drone data
- Climate data
- Field technician observations
- Crop data
Models
The Machine Learning portion of the project includes learning about six pre-implemented regression models:
- Partial Least Squares Regression (PLS)
- Lasso Regression
- ElasticNet Regression
- Bayesian Ridge Regression
- Extreme Gradient Boosting (XGBoost)
- Support Vector Regression (SVR)
You are encouraged to explore these models and even implement your own, such as Random Forest or Linear Regression after completing our module!
Tips for Success
- Read the Instructions: Carefully follow the guides for setting up and running the code.
- Stay Organized: Keep your data, scripts, and results in a well-structured directory.
- Experiment: Don’t hesitate to tweak model parameters and explore alternative approaches!
- Ask for Help: Reach out to your instructor or peers if you encounter challenges.
Getting Help
If you encounter challenges or have questions, there are several resources to support you:
- Ask Your Instructor: Your educator is there to help clarify instructions and troubleshoot issues.
- Internet Forums: Visit popular code forums like Stack Overflow to have your questions answered in depth.
- Google It: Use search engines to look up terms or code that you find challenging.
- Review Documentation: Refer to this guide or library-specific documentation for deeper insights.
You should know!
Learning is a process. Asking for help and using resources effectively are important parts of that process!
Submitting an Issue
If you find an issue with the project or need further assistance, feel free to reach out to the lab directly:
If you need to reach out to the administrators of the ARE program, please contact the following:
- Email: ARE@danforthcenter.org
We appreciate your feedback and will do our best to assist you promptly!
Continued Learning
Want to learn more about basic coding before you start? Checkout these resources below!
Coding
Visit this link to learn more about what are filepaths and why they are important in coding: Understanding File Paths
Visit this link to see an introductory guide to learning to code: Introduction to Coding
Find out more about one of the most popular forums used for coding help and advice: What is Stack Overflow
Code Editors
Visit this link to learn more about the basic features of Google Colab: Basic Features of Google Colab
Here is a resource on see what other online code environemnts exist: An Introduction to Colab and Jupyter for Beginners
Please visit this source if you want to learn more about the different types of machine learning: Five Machine Learning Types to Know
Technology
To learn more about the PheNode and the technology behind it: PheNode website
To learn more about the FieldDock and the technology behind it: FieldDock website